Chippewa vs Spanish American Indian Male Unemployment
COMPARE
Chippewa
Spanish American Indian
Male Unemployment
Male Unemployment Comparison
Chippewa
Spanish American Indians
6.6%
MALE UNEMPLOYMENT
0.0/ 100
METRIC RATING
297th/ 347
METRIC RANK
6.2%
MALE UNEMPLOYMENT
0.0/ 100
METRIC RATING
284th/ 347
METRIC RANK
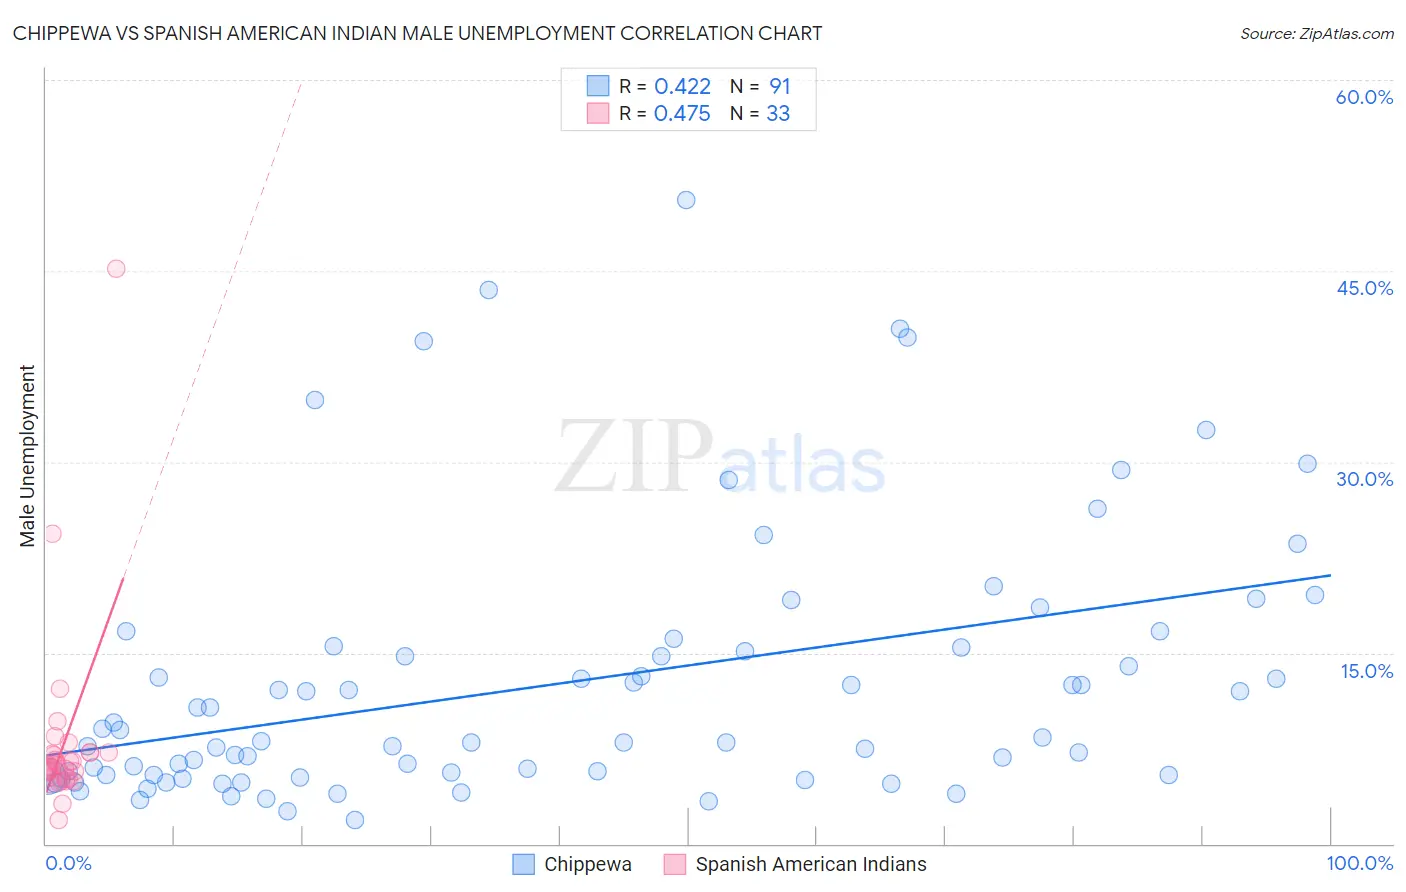
Chippewa vs Spanish American Indian Male Unemployment Correlation Chart
The statistical analysis conducted on geographies consisting of 214,243,166 people shows a moderate positive correlation between the proportion of Chippewa and unemployment rate among males in the United States with a correlation coefficient (R) of 0.422 and weighted average of 6.6%. Similarly, the statistical analysis conducted on geographies consisting of 73,090,721 people shows a moderate positive correlation between the proportion of Spanish American Indians and unemployment rate among males in the United States with a correlation coefficient (R) of 0.475 and weighted average of 6.2%, a difference of 5.2%.
Male Unemployment Correlation Summary
| Measurement | Chippewa | Spanish American Indian |
| Minimum | 1.9% | 1.9% |
| Maximum | 50.6% | 45.2% |
| Range | 48.7% | 43.3% |
| Mean | 12.5% | 7.9% |
| Median | 8.0% | 6.0% |
| Interquartile 25% (IQ1) | 5.4% | 5.1% |
| Interquartile 75% (IQ3) | 15.4% | 7.2% |
| Interquartile Range (IQR) | 10.0% | 2.1% |
| Standard Deviation (Sample) | 10.3% | 7.6% |
| Standard Deviation (Population) | 10.3% | 7.5% |
Demographics Similar to Chippewa and Spanish American Indians by Male Unemployment
In terms of male unemployment, the demographic groups most similar to Chippewa are Jamaican (6.6%, a difference of 0.080%), Immigrants from Bangladesh (6.6%, a difference of 0.21%), Immigrants from Haiti (6.5%, a difference of 0.32%), Vietnamese (6.6%, a difference of 0.48%), and Belizean (6.5%, a difference of 0.77%). Similarly, the demographic groups most similar to Spanish American Indians are Immigrants from Ecuador (6.2%, a difference of 0.020%), African (6.3%, a difference of 0.45%), Immigrants from Western Africa (6.2%, a difference of 0.65%), Ecuadorian (6.2%, a difference of 0.68%), and Central American Indian (6.3%, a difference of 0.74%).
| Demographics | Rating | Rank | Male Unemployment |
| Immigrants | Ghana | 0.0 /100 | #280 | Tragic 6.2% |
| Sierra Leoneans | 0.0 /100 | #281 | Tragic 6.2% |
| Ecuadorians | 0.0 /100 | #282 | Tragic 6.2% |
| Immigrants | Western Africa | 0.0 /100 | #283 | Tragic 6.2% |
| Spanish American Indians | 0.0 /100 | #284 | Tragic 6.2% |
| Immigrants | Ecuador | 0.0 /100 | #285 | Tragic 6.2% |
| Africans | 0.0 /100 | #286 | Tragic 6.3% |
| Central American Indians | 0.0 /100 | #287 | Tragic 6.3% |
| Immigrants | Senegal | 0.0 /100 | #288 | Tragic 6.3% |
| Immigrants | Caribbean | 0.0 /100 | #289 | Tragic 6.3% |
| U.S. Virgin Islanders | 0.0 /100 | #290 | Tragic 6.4% |
| Immigrants | Azores | 0.0 /100 | #291 | Tragic 6.4% |
| Nepalese | 0.0 /100 | #292 | Tragic 6.4% |
| Haitians | 0.0 /100 | #293 | Tragic 6.4% |
| Senegalese | 0.0 /100 | #294 | Tragic 6.4% |
| Belizeans | 0.0 /100 | #295 | Tragic 6.5% |
| Immigrants | Haiti | 0.0 /100 | #296 | Tragic 6.5% |
| Chippewa | 0.0 /100 | #297 | Tragic 6.6% |
| Jamaicans | 0.0 /100 | #298 | Tragic 6.6% |
| Immigrants | Bangladesh | 0.0 /100 | #299 | Tragic 6.6% |
| Vietnamese | 0.0 /100 | #300 | Tragic 6.6% |