Soviet Union vs Spanish American Indian Median Male Earnings
COMPARE
Soviet Union
Spanish American Indian
Median Male Earnings
Median Male Earnings Comparison
Soviet Union
Spanish American Indians
$63,382
MEDIAN MALE EARNINGS
100.0/ 100
METRIC RATING
32nd/ 347
METRIC RANK
$44,010
MEDIAN MALE EARNINGS
0.0/ 100
METRIC RATING
335th/ 347
METRIC RANK
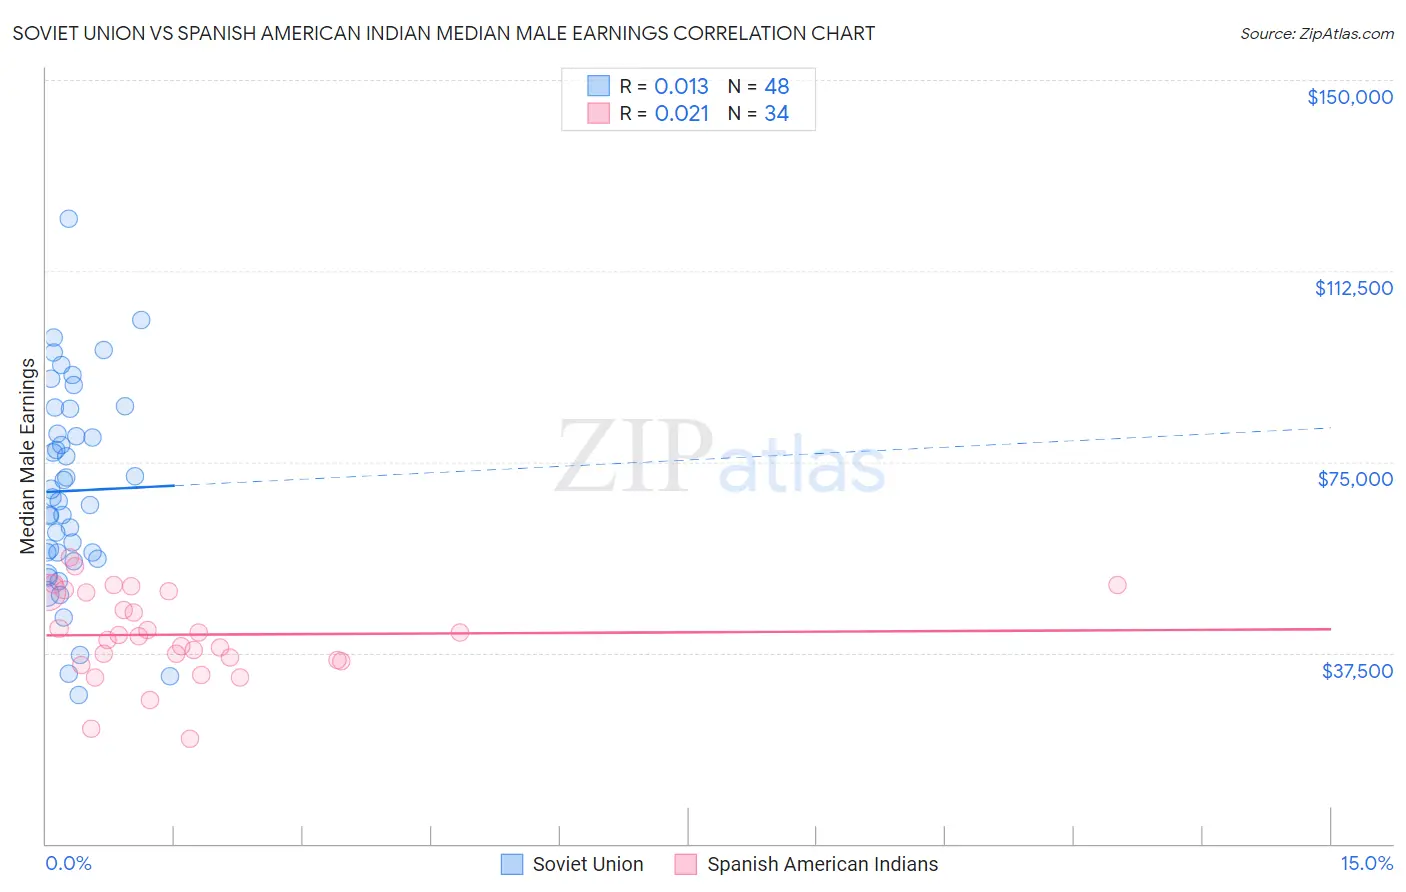
Soviet Union vs Spanish American Indian Median Male Earnings Correlation Chart
The statistical analysis conducted on geographies consisting of 43,507,869 people shows no correlation between the proportion of Soviet Union and median male earnings in the United States with a correlation coefficient (R) of 0.013 and weighted average of $63,382. Similarly, the statistical analysis conducted on geographies consisting of 73,148,083 people shows no correlation between the proportion of Spanish American Indians and median male earnings in the United States with a correlation coefficient (R) of 0.021 and weighted average of $44,010, a difference of 44.0%.
Median Male Earnings Correlation Summary
| Measurement | Soviet Union | Spanish American Indian |
| Minimum | $29,197 | $20,599 |
| Maximum | $122,813 | $56,169 |
| Range | $93,616 | $35,570 |
| Mean | $69,321 | $41,061 |
| Median | $67,564 | $40,899 |
| Interquartile 25% (IQ1) | $56,498 | $35,978 |
| Interquartile 75% (IQ3) | $82,953 | $49,409 |
| Interquartile Range (IQR) | $26,455 | $13,431 |
| Standard Deviation (Sample) | $19,957 | $8,549 |
| Standard Deviation (Population) | $19,748 | $8,423 |
Similar Demographics by Median Male Earnings
Demographics Similar to Soviet Union by Median Male Earnings
In terms of median male earnings, the demographic groups most similar to Soviet Union are Immigrants from Lithuania ($63,346, a difference of 0.060%), Immigrants from Russia ($63,326, a difference of 0.090%), Latvian ($63,498, a difference of 0.18%), Immigrants from Asia ($63,240, a difference of 0.22%), and Israeli ($63,228, a difference of 0.24%).
| Demographics | Rating | Rank | Median Male Earnings |
| Immigrants | Denmark | 100.0 /100 | #25 | Exceptional $64,625 |
| Turks | 100.0 /100 | #26 | Exceptional $64,253 |
| Immigrants | Switzerland | 100.0 /100 | #27 | Exceptional $63,944 |
| Russians | 100.0 /100 | #28 | Exceptional $63,939 |
| Asians | 100.0 /100 | #29 | Exceptional $63,827 |
| Immigrants | France | 100.0 /100 | #30 | Exceptional $63,715 |
| Latvians | 100.0 /100 | #31 | Exceptional $63,498 |
| Soviet Union | 100.0 /100 | #32 | Exceptional $63,382 |
| Immigrants | Lithuania | 100.0 /100 | #33 | Exceptional $63,346 |
| Immigrants | Russia | 100.0 /100 | #34 | Exceptional $63,326 |
| Immigrants | Asia | 100.0 /100 | #35 | Exceptional $63,240 |
| Israelis | 100.0 /100 | #36 | Exceptional $63,228 |
| Immigrants | Sri Lanka | 100.0 /100 | #37 | Exceptional $63,099 |
| Maltese | 100.0 /100 | #38 | Exceptional $62,953 |
| Immigrants | South Africa | 100.0 /100 | #39 | Exceptional $62,899 |
Demographics Similar to Spanish American Indians by Median Male Earnings
In terms of median male earnings, the demographic groups most similar to Spanish American Indians are Immigrants from Yemen ($44,083, a difference of 0.17%), Immigrants from Congo ($44,204, a difference of 0.44%), Immigrants from Cuba ($43,461, a difference of 1.3%), Bahamian ($44,756, a difference of 1.7%), and Native/Alaskan ($44,775, a difference of 1.7%).
| Demographics | Rating | Rank | Median Male Earnings |
| Kiowa | 0.0 /100 | #328 | Tragic $45,094 |
| Yakama | 0.0 /100 | #329 | Tragic $45,002 |
| Immigrants | Mexico | 0.0 /100 | #330 | Tragic $44,960 |
| Natives/Alaskans | 0.0 /100 | #331 | Tragic $44,775 |
| Bahamians | 0.0 /100 | #332 | Tragic $44,756 |
| Immigrants | Congo | 0.0 /100 | #333 | Tragic $44,204 |
| Immigrants | Yemen | 0.0 /100 | #334 | Tragic $44,083 |
| Spanish American Indians | 0.0 /100 | #335 | Tragic $44,010 |
| Immigrants | Cuba | 0.0 /100 | #336 | Tragic $43,461 |
| Menominee | 0.0 /100 | #337 | Tragic $42,581 |
| Crow | 0.0 /100 | #338 | Tragic $42,434 |
| Pima | 0.0 /100 | #339 | Tragic $42,357 |
| Navajo | 0.0 /100 | #340 | Tragic $42,098 |
| Hopi | 0.0 /100 | #341 | Tragic $42,060 |
| Arapaho | 0.0 /100 | #342 | Tragic $41,758 |