Samoan vs Spanish American Indian Median Male Earnings
COMPARE
Samoan
Spanish American Indian
Median Male Earnings
Median Male Earnings Comparison
Samoans
Spanish American Indians
$51,389
MEDIAN MALE EARNINGS
4.6/ 100
METRIC RATING
228th/ 347
METRIC RANK
$44,010
MEDIAN MALE EARNINGS
0.0/ 100
METRIC RATING
335th/ 347
METRIC RANK
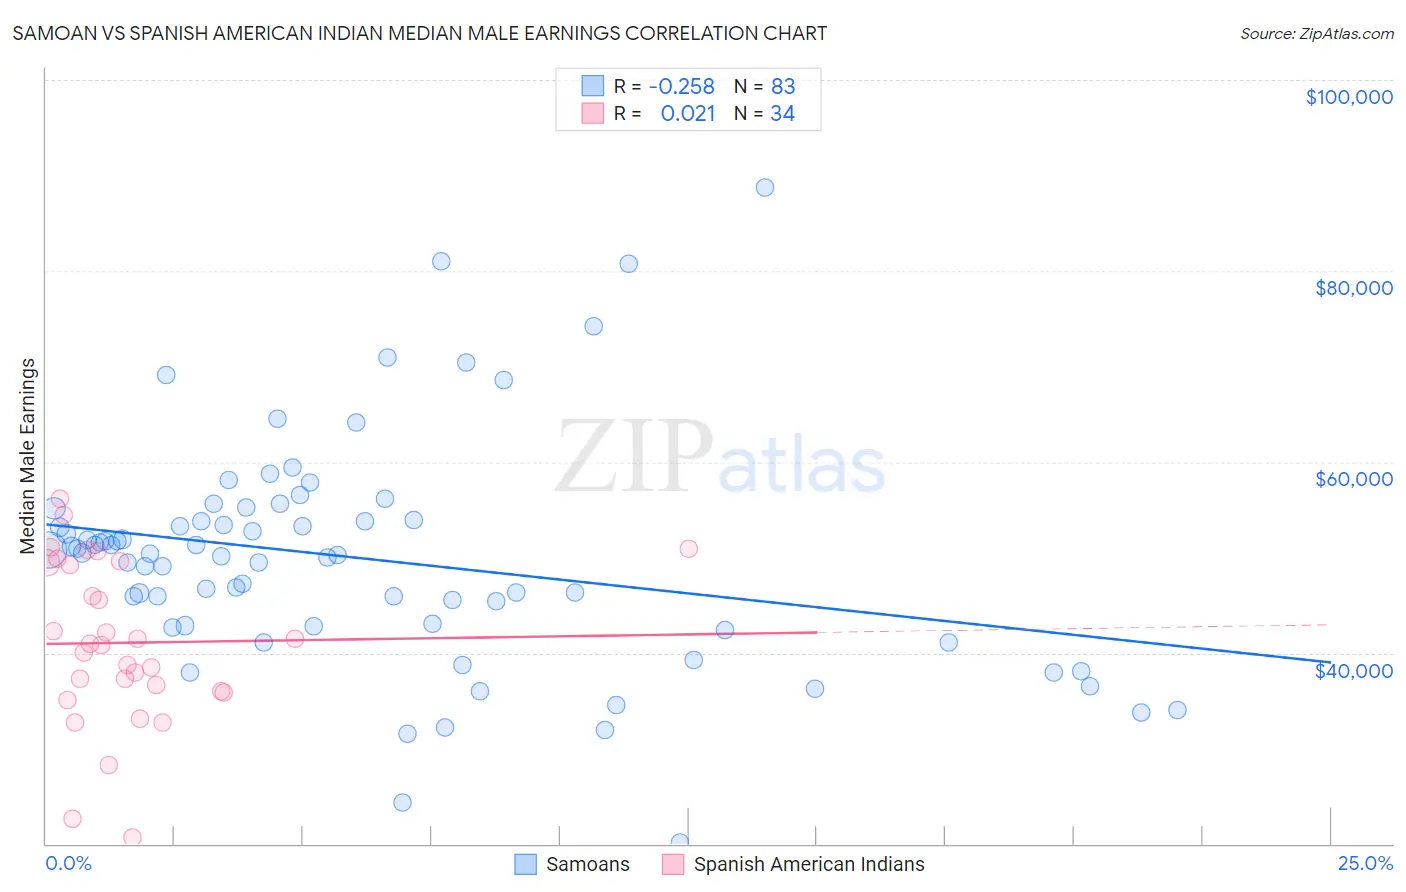
Samoan vs Spanish American Indian Median Male Earnings Correlation Chart
The statistical analysis conducted on geographies consisting of 225,157,304 people shows a weak negative correlation between the proportion of Samoans and median male earnings in the United States with a correlation coefficient (R) of -0.258 and weighted average of $51,389. Similarly, the statistical analysis conducted on geographies consisting of 73,148,083 people shows no correlation between the proportion of Spanish American Indians and median male earnings in the United States with a correlation coefficient (R) of 0.021 and weighted average of $44,010, a difference of 16.8%.
Median Male Earnings Correlation Summary
| Measurement | Samoan | Spanish American Indian |
| Minimum | $20,179 | $20,599 |
| Maximum | $88,750 | $56,169 |
| Range | $68,571 | $35,570 |
| Mean | $49,891 | $41,061 |
| Median | $50,415 | $40,899 |
| Interquartile 25% (IQ1) | $42,816 | $35,978 |
| Interquartile 75% (IQ3) | $53,887 | $49,409 |
| Interquartile Range (IQR) | $11,071 | $13,431 |
| Standard Deviation (Sample) | $11,942 | $8,549 |
| Standard Deviation (Population) | $11,870 | $8,423 |
Similar Demographics by Median Male Earnings
Demographics Similar to Samoans by Median Male Earnings
In terms of median male earnings, the demographic groups most similar to Samoans are Immigrants from Trinidad and Tobago ($51,376, a difference of 0.030%), Trinidadian and Tobagonian ($51,446, a difference of 0.11%), Japanese ($51,473, a difference of 0.16%), Immigrants from Nigeria ($51,310, a difference of 0.16%), and Immigrants from Sudan ($51,489, a difference of 0.19%).
| Demographics | Rating | Rank | Median Male Earnings |
| Immigrants | Senegal | 5.8 /100 | #221 | Tragic $51,647 |
| Immigrants | Bangladesh | 5.8 /100 | #222 | Tragic $51,642 |
| Ecuadorians | 5.5 /100 | #223 | Tragic $51,596 |
| Immigrants | Cambodia | 5.5 /100 | #224 | Tragic $51,594 |
| Immigrants | Sudan | 5.0 /100 | #225 | Tragic $51,489 |
| Japanese | 4.9 /100 | #226 | Tragic $51,473 |
| Trinidadians and Tobagonians | 4.8 /100 | #227 | Tragic $51,446 |
| Samoans | 4.6 /100 | #228 | Tragic $51,389 |
| Immigrants | Trinidad and Tobago | 4.5 /100 | #229 | Tragic $51,376 |
| Immigrants | Nigeria | 4.2 /100 | #230 | Tragic $51,310 |
| Barbadians | 3.9 /100 | #231 | Tragic $51,236 |
| Sudanese | 3.9 /100 | #232 | Tragic $51,216 |
| Aleuts | 3.7 /100 | #233 | Tragic $51,168 |
| Cape Verdeans | 3.5 /100 | #234 | Tragic $51,103 |
| Immigrants | Western Africa | 3.0 /100 | #235 | Tragic $50,940 |
Demographics Similar to Spanish American Indians by Median Male Earnings
In terms of median male earnings, the demographic groups most similar to Spanish American Indians are Immigrants from Yemen ($44,083, a difference of 0.17%), Immigrants from Congo ($44,204, a difference of 0.44%), Immigrants from Cuba ($43,461, a difference of 1.3%), Bahamian ($44,756, a difference of 1.7%), and Native/Alaskan ($44,775, a difference of 1.7%).
| Demographics | Rating | Rank | Median Male Earnings |
| Kiowa | 0.0 /100 | #328 | Tragic $45,094 |
| Yakama | 0.0 /100 | #329 | Tragic $45,002 |
| Immigrants | Mexico | 0.0 /100 | #330 | Tragic $44,960 |
| Natives/Alaskans | 0.0 /100 | #331 | Tragic $44,775 |
| Bahamians | 0.0 /100 | #332 | Tragic $44,756 |
| Immigrants | Congo | 0.0 /100 | #333 | Tragic $44,204 |
| Immigrants | Yemen | 0.0 /100 | #334 | Tragic $44,083 |
| Spanish American Indians | 0.0 /100 | #335 | Tragic $44,010 |
| Immigrants | Cuba | 0.0 /100 | #336 | Tragic $43,461 |
| Menominee | 0.0 /100 | #337 | Tragic $42,581 |
| Crow | 0.0 /100 | #338 | Tragic $42,434 |
| Pima | 0.0 /100 | #339 | Tragic $42,357 |
| Navajo | 0.0 /100 | #340 | Tragic $42,098 |
| Hopi | 0.0 /100 | #341 | Tragic $42,060 |
| Arapaho | 0.0 /100 | #342 | Tragic $41,758 |