Swedish vs Immigrants from Russia Median Female Earnings
COMPARE
Swedish
Immigrants from Russia
Median Female Earnings
Median Female Earnings Comparison
Swedes
Immigrants from Russia
$39,421
MEDIAN FEMALE EARNINGS
36.0/ 100
METRIC RATING
187th/ 347
METRIC RANK
$44,680
MEDIAN FEMALE EARNINGS
100.0/ 100
METRIC RATING
28th/ 347
METRIC RANK
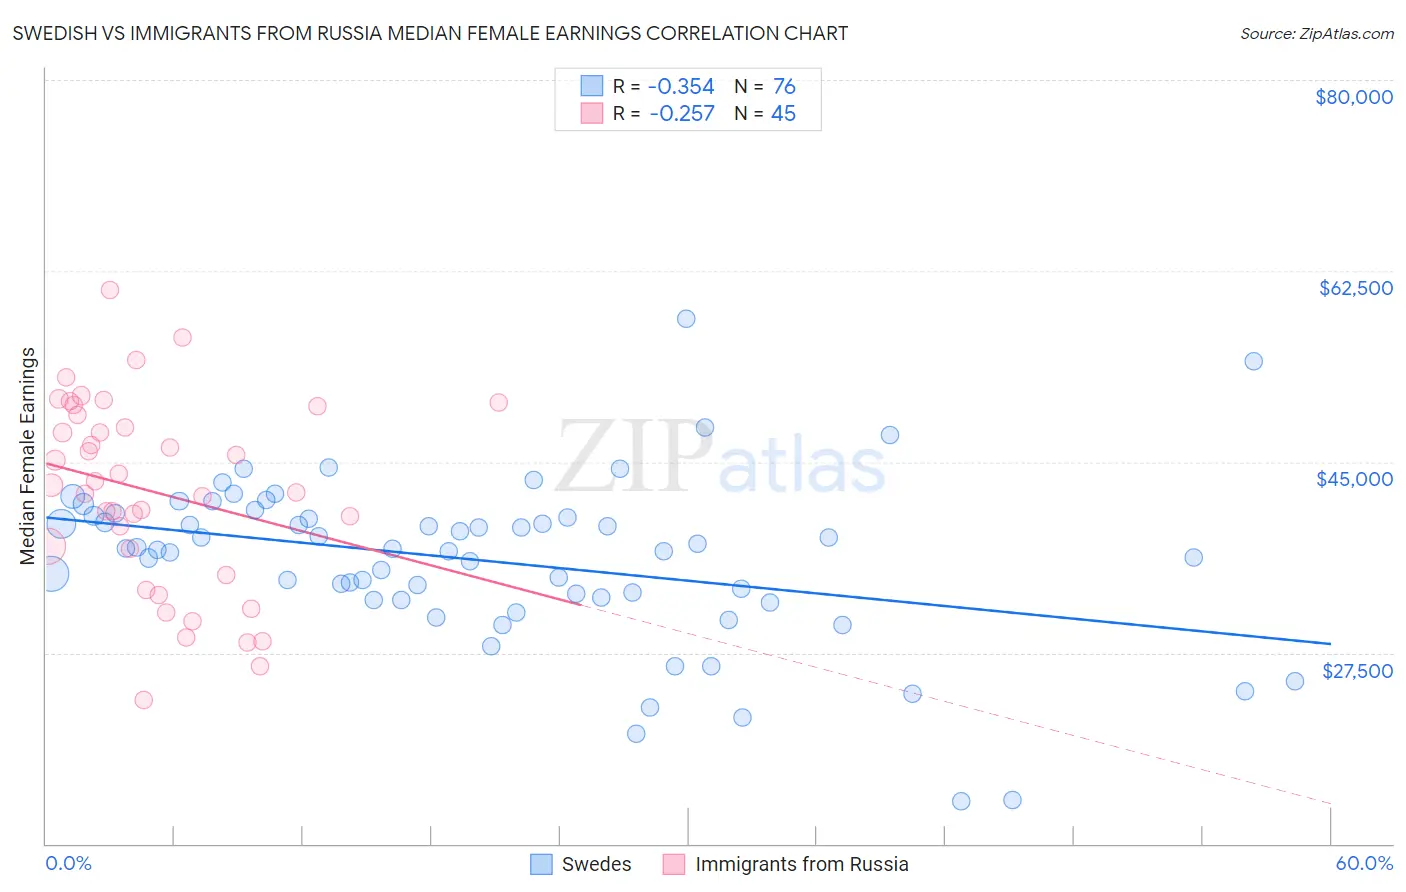
Swedish vs Immigrants from Russia Median Female Earnings Correlation Chart
The statistical analysis conducted on geographies consisting of 538,112,894 people shows a mild negative correlation between the proportion of Swedes and median female earnings in the United States with a correlation coefficient (R) of -0.354 and weighted average of $39,421. Similarly, the statistical analysis conducted on geographies consisting of 347,839,336 people shows a weak negative correlation between the proportion of Immigrants from Russia and median female earnings in the United States with a correlation coefficient (R) of -0.257 and weighted average of $44,680, a difference of 13.3%.
Median Female Earnings Correlation Summary
| Measurement | Swedish | Immigrants from Russia |
| Minimum | $13,839 | $23,199 |
| Maximum | $58,087 | $60,754 |
| Range | $44,248 | $37,555 |
| Mean | $35,925 | $42,242 |
| Median | $36,993 | $42,848 |
| Interquartile 25% (IQ1) | $32,470 | $35,838 |
| Interquartile 75% (IQ3) | $39,982 | $49,732 |
| Interquartile Range (IQR) | $7,512 | $13,894 |
| Standard Deviation (Sample) | $7,648 | $8,738 |
| Standard Deviation (Population) | $7,597 | $8,640 |
Similar Demographics by Median Female Earnings
Demographics Similar to Swedes by Median Female Earnings
In terms of median female earnings, the demographic groups most similar to Swedes are Bermudan ($39,418, a difference of 0.010%), Immigrants from West Indies ($39,441, a difference of 0.050%), Colombian ($39,439, a difference of 0.050%), European ($39,457, a difference of 0.090%), and Senegalese ($39,384, a difference of 0.090%).
| Demographics | Rating | Rank | Median Female Earnings |
| Immigrants | Kenya | 41.6 /100 | #180 | Average $39,535 |
| Tsimshian | 41.4 /100 | #181 | Average $39,530 |
| Tlingit-Haida | 40.5 /100 | #182 | Average $39,513 |
| Hungarians | 40.3 /100 | #183 | Average $39,510 |
| Europeans | 37.7 /100 | #184 | Fair $39,457 |
| Immigrants | West Indies | 36.9 /100 | #185 | Fair $39,441 |
| Colombians | 36.9 /100 | #186 | Fair $39,439 |
| Swedes | 36.0 /100 | #187 | Fair $39,421 |
| Bermudans | 35.9 /100 | #188 | Fair $39,418 |
| Senegalese | 34.2 /100 | #189 | Fair $39,384 |
| Puget Sound Salish | 33.9 /100 | #190 | Fair $39,376 |
| Immigrants | Western Africa | 32.7 /100 | #191 | Fair $39,351 |
| Immigrants | Immigrants | 31.7 /100 | #192 | Fair $39,328 |
| Immigrants | Nigeria | 30.2 /100 | #193 | Fair $39,294 |
| Irish | 30.0 /100 | #194 | Fair $39,291 |
Demographics Similar to Immigrants from Russia by Median Female Earnings
In terms of median female earnings, the demographic groups most similar to Immigrants from Russia are Turkish ($44,695, a difference of 0.030%), Immigrants from Belarus ($44,757, a difference of 0.17%), Immigrants from Sweden ($44,774, a difference of 0.21%), Immigrants from Belgium ($44,587, a difference of 0.21%), and Asian ($44,586, a difference of 0.21%).
| Demographics | Rating | Rank | Median Female Earnings |
| Cambodians | 100.0 /100 | #21 | Exceptional $45,014 |
| Immigrants | Greece | 100.0 /100 | #22 | Exceptional $44,976 |
| Burmese | 100.0 /100 | #23 | Exceptional $44,911 |
| Immigrants | Korea | 100.0 /100 | #24 | Exceptional $44,847 |
| Immigrants | Sweden | 100.0 /100 | #25 | Exceptional $44,774 |
| Immigrants | Belarus | 100.0 /100 | #26 | Exceptional $44,757 |
| Turks | 100.0 /100 | #27 | Exceptional $44,695 |
| Immigrants | Russia | 100.0 /100 | #28 | Exceptional $44,680 |
| Immigrants | Belgium | 100.0 /100 | #29 | Exceptional $44,587 |
| Asians | 100.0 /100 | #30 | Exceptional $44,586 |
| Immigrants | France | 100.0 /100 | #31 | Exceptional $44,541 |
| Immigrants | Northern Europe | 100.0 /100 | #32 | Exceptional $44,366 |
| Immigrants | Asia | 100.0 /100 | #33 | Exceptional $44,198 |
| Russians | 100.0 /100 | #34 | Exceptional $44,169 |
| Immigrants | Sri Lanka | 100.0 /100 | #35 | Exceptional $44,161 |