Immigrants from Saudi Arabia vs Immigrants from Russia Median Female Earnings
COMPARE
Immigrants from Saudi Arabia
Immigrants from Russia
Median Female Earnings
Median Female Earnings Comparison
Immigrants from Saudi Arabia
Immigrants from Russia
$39,952
MEDIAN FEMALE EARNINGS
62.9/ 100
METRIC RATING
164th/ 347
METRIC RANK
$44,680
MEDIAN FEMALE EARNINGS
100.0/ 100
METRIC RATING
28th/ 347
METRIC RANK
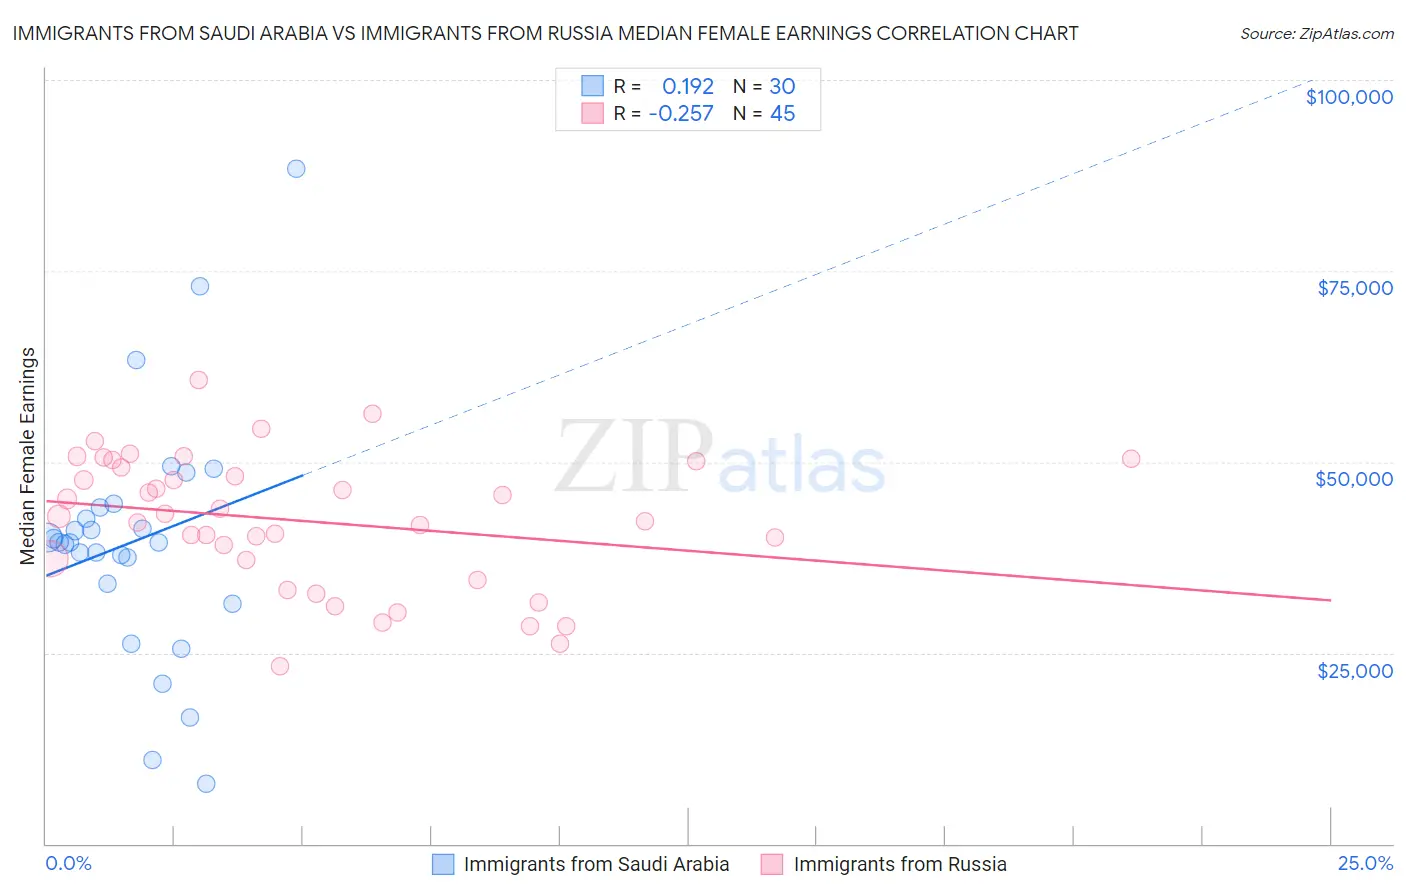
Immigrants from Saudi Arabia vs Immigrants from Russia Median Female Earnings Correlation Chart
The statistical analysis conducted on geographies consisting of 164,288,705 people shows a poor positive correlation between the proportion of Immigrants from Saudi Arabia and median female earnings in the United States with a correlation coefficient (R) of 0.192 and weighted average of $39,952. Similarly, the statistical analysis conducted on geographies consisting of 347,839,336 people shows a weak negative correlation between the proportion of Immigrants from Russia and median female earnings in the United States with a correlation coefficient (R) of -0.257 and weighted average of $44,680, a difference of 11.8%.
Median Female Earnings Correlation Summary
| Measurement | Immigrants from Saudi Arabia | Immigrants from Russia |
| Minimum | $7,776 | $23,199 |
| Maximum | $88,365 | $60,754 |
| Range | $80,589 | $37,555 |
| Mean | $39,642 | $42,242 |
| Median | $39,517 | $42,848 |
| Interquartile 25% (IQ1) | $34,071 | $35,838 |
| Interquartile 75% (IQ3) | $44,081 | $49,732 |
| Interquartile Range (IQR) | $10,011 | $13,894 |
| Standard Deviation (Sample) | $16,173 | $8,738 |
| Standard Deviation (Population) | $15,901 | $8,640 |
Similar Demographics by Median Female Earnings
Demographics Similar to Immigrants from Saudi Arabia by Median Female Earnings
In terms of median female earnings, the demographic groups most similar to Immigrants from Saudi Arabia are Immigrants from Bangladesh ($39,910, a difference of 0.11%), Lebanese ($40,006, a difference of 0.14%), Immigrants from Ghana ($39,894, a difference of 0.15%), Luxembourger ($39,891, a difference of 0.15%), and South American Indian ($40,019, a difference of 0.17%).
| Demographics | Rating | Rank | Median Female Earnings |
| Portuguese | 73.0 /100 | #157 | Good $40,177 |
| Immigrants | Senegal | 72.2 /100 | #158 | Good $40,157 |
| Immigrants | Vietnam | 72.0 /100 | #159 | Good $40,153 |
| Inupiat | 68.9 /100 | #160 | Good $40,080 |
| Alsatians | 68.0 /100 | #161 | Good $40,060 |
| South American Indians | 66.1 /100 | #162 | Good $40,019 |
| Lebanese | 65.5 /100 | #163 | Good $40,006 |
| Immigrants | Saudi Arabia | 62.9 /100 | #164 | Good $39,952 |
| Immigrants | Bangladesh | 60.8 /100 | #165 | Good $39,910 |
| Immigrants | Ghana | 60.0 /100 | #166 | Good $39,894 |
| Luxembourgers | 59.9 /100 | #167 | Average $39,891 |
| Immigrants | Peru | 58.9 /100 | #168 | Average $39,871 |
| Kenyans | 58.4 /100 | #169 | Average $39,860 |
| Slovenes | 56.2 /100 | #170 | Average $39,817 |
| Immigrants | Portugal | 54.7 /100 | #171 | Average $39,788 |
Demographics Similar to Immigrants from Russia by Median Female Earnings
In terms of median female earnings, the demographic groups most similar to Immigrants from Russia are Turkish ($44,695, a difference of 0.030%), Immigrants from Belarus ($44,757, a difference of 0.17%), Immigrants from Sweden ($44,774, a difference of 0.21%), Immigrants from Belgium ($44,587, a difference of 0.21%), and Asian ($44,586, a difference of 0.21%).
| Demographics | Rating | Rank | Median Female Earnings |
| Cambodians | 100.0 /100 | #21 | Exceptional $45,014 |
| Immigrants | Greece | 100.0 /100 | #22 | Exceptional $44,976 |
| Burmese | 100.0 /100 | #23 | Exceptional $44,911 |
| Immigrants | Korea | 100.0 /100 | #24 | Exceptional $44,847 |
| Immigrants | Sweden | 100.0 /100 | #25 | Exceptional $44,774 |
| Immigrants | Belarus | 100.0 /100 | #26 | Exceptional $44,757 |
| Turks | 100.0 /100 | #27 | Exceptional $44,695 |
| Immigrants | Russia | 100.0 /100 | #28 | Exceptional $44,680 |
| Immigrants | Belgium | 100.0 /100 | #29 | Exceptional $44,587 |
| Asians | 100.0 /100 | #30 | Exceptional $44,586 |
| Immigrants | France | 100.0 /100 | #31 | Exceptional $44,541 |
| Immigrants | Northern Europe | 100.0 /100 | #32 | Exceptional $44,366 |
| Immigrants | Asia | 100.0 /100 | #33 | Exceptional $44,198 |
| Russians | 100.0 /100 | #34 | Exceptional $44,169 |
| Immigrants | Sri Lanka | 100.0 /100 | #35 | Exceptional $44,161 |