Chinese vs Immigrants from Oceania 8th Grade
COMPARE
Chinese
Immigrants from Oceania
8th Grade
8th Grade Comparison
Chinese
Immigrants from Oceania
96.9%
8TH GRADE
100.0/ 100
METRIC RATING
42nd/ 347
METRIC RANK
95.3%
8TH GRADE
7.1/ 100
METRIC RATING
223rd/ 347
METRIC RANK
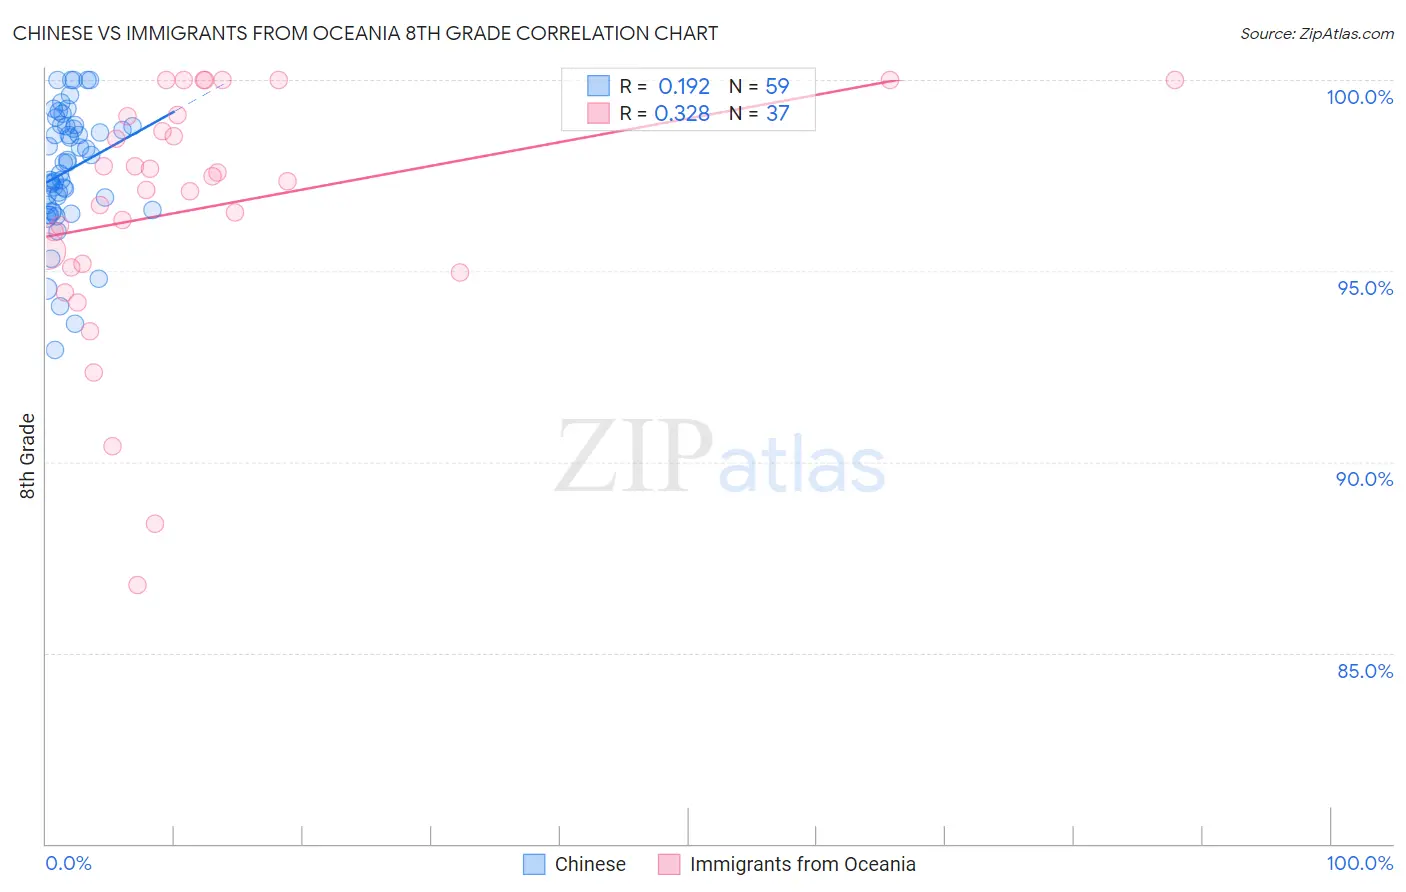
Chinese vs Immigrants from Oceania 8th Grade Correlation Chart
The statistical analysis conducted on geographies consisting of 64,809,883 people shows a poor positive correlation between the proportion of Chinese and percentage of population with at least 8th grade education in the United States with a correlation coefficient (R) of 0.192 and weighted average of 96.9%. Similarly, the statistical analysis conducted on geographies consisting of 305,521,521 people shows a mild positive correlation between the proportion of Immigrants from Oceania and percentage of population with at least 8th grade education in the United States with a correlation coefficient (R) of 0.328 and weighted average of 95.3%, a difference of 1.7%.
8th Grade Correlation Summary
| Measurement | Chinese | Immigrants from Oceania |
| Minimum | 92.9% | 86.8% |
| Maximum | 100.0% | 100.0% |
| Range | 7.1% | 13.2% |
| Mean | 97.6% | 96.6% |
| Median | 97.8% | 97.3% |
| Interquartile 25% (IQ1) | 96.6% | 95.1% |
| Interquartile 75% (IQ3) | 98.8% | 99.1% |
| Interquartile Range (IQR) | 2.2% | 3.9% |
| Standard Deviation (Sample) | 1.6% | 3.2% |
| Standard Deviation (Population) | 1.6% | 3.2% |
Similar Demographics by 8th Grade
Demographics Similar to Chinese by 8th Grade
In terms of 8th grade, the demographic groups most similar to Chinese are Aleut (96.9%, a difference of 0.030%), Inupiat (97.0%, a difference of 0.040%), Eastern European (97.0%, a difference of 0.040%), Maltese (96.9%, a difference of 0.050%), and Northern European (96.9%, a difference of 0.050%).
| Demographics | Rating | Rank | 8th Grade |
| Alaska Natives | 100.0 /100 | #35 | Exceptional 97.0% |
| Belgians | 100.0 /100 | #36 | Exceptional 97.0% |
| Latvians | 100.0 /100 | #37 | Exceptional 97.0% |
| British | 100.0 /100 | #38 | Exceptional 97.0% |
| Hungarians | 100.0 /100 | #39 | Exceptional 97.0% |
| Inupiat | 100.0 /100 | #40 | Exceptional 97.0% |
| Eastern Europeans | 100.0 /100 | #41 | Exceptional 97.0% |
| Chinese | 100.0 /100 | #42 | Exceptional 96.9% |
| Aleuts | 99.9 /100 | #43 | Exceptional 96.9% |
| Maltese | 99.9 /100 | #44 | Exceptional 96.9% |
| Northern Europeans | 99.9 /100 | #45 | Exceptional 96.9% |
| Czechoslovakians | 99.9 /100 | #46 | Exceptional 96.9% |
| Bulgarians | 99.9 /100 | #47 | Exceptional 96.9% |
| Slavs | 99.9 /100 | #48 | Exceptional 96.8% |
| Estonians | 99.9 /100 | #49 | Exceptional 96.8% |
Demographics Similar to Immigrants from Oceania by 8th Grade
In terms of 8th grade, the demographic groups most similar to Immigrants from Oceania are Immigrants from Malaysia (95.3%, a difference of 0.0%), Immigrants from Southern Europe (95.3%, a difference of 0.010%), Immigrants from Syria (95.3%, a difference of 0.010%), Dutch West Indian (95.4%, a difference of 0.020%), and Spanish American (95.4%, a difference of 0.020%).
| Demographics | Rating | Rank | 8th Grade |
| Samoans | 8.4 /100 | #216 | Tragic 95.4% |
| Immigrants | Eastern Asia | 8.3 /100 | #217 | Tragic 95.4% |
| Dutch West Indians | 8.1 /100 | #218 | Tragic 95.4% |
| Spanish Americans | 8.0 /100 | #219 | Tragic 95.4% |
| Immigrants | Southern Europe | 7.7 /100 | #220 | Tragic 95.3% |
| Immigrants | Syria | 7.4 /100 | #221 | Tragic 95.3% |
| Immigrants | Malaysia | 7.3 /100 | #222 | Tragic 95.3% |
| Immigrants | Oceania | 7.1 /100 | #223 | Tragic 95.3% |
| Immigrants | Western Asia | 6.0 /100 | #224 | Tragic 95.3% |
| Sub-Saharan Africans | 6.0 /100 | #225 | Tragic 95.3% |
| Navajo | 5.7 /100 | #226 | Tragic 95.3% |
| Bahamians | 5.6 /100 | #227 | Tragic 95.3% |
| Immigrants | Eastern Africa | 5.6 /100 | #228 | Tragic 95.3% |
| Immigrants | Indonesia | 4.4 /100 | #229 | Tragic 95.3% |
| Immigrants | Panama | 4.1 /100 | #230 | Tragic 95.2% |