Canadian vs Immigrants from Oceania Median Female Earnings
COMPARE
Canadian
Immigrants from Oceania
Median Female Earnings
Median Female Earnings Comparison
Canadians
Immigrants from Oceania
$39,724
MEDIAN FEMALE EARNINGS
51.4/ 100
METRIC RATING
173rd/ 347
METRIC RANK
$40,297
MEDIAN FEMALE EARNINGS
77.6/ 100
METRIC RATING
154th/ 347
METRIC RANK
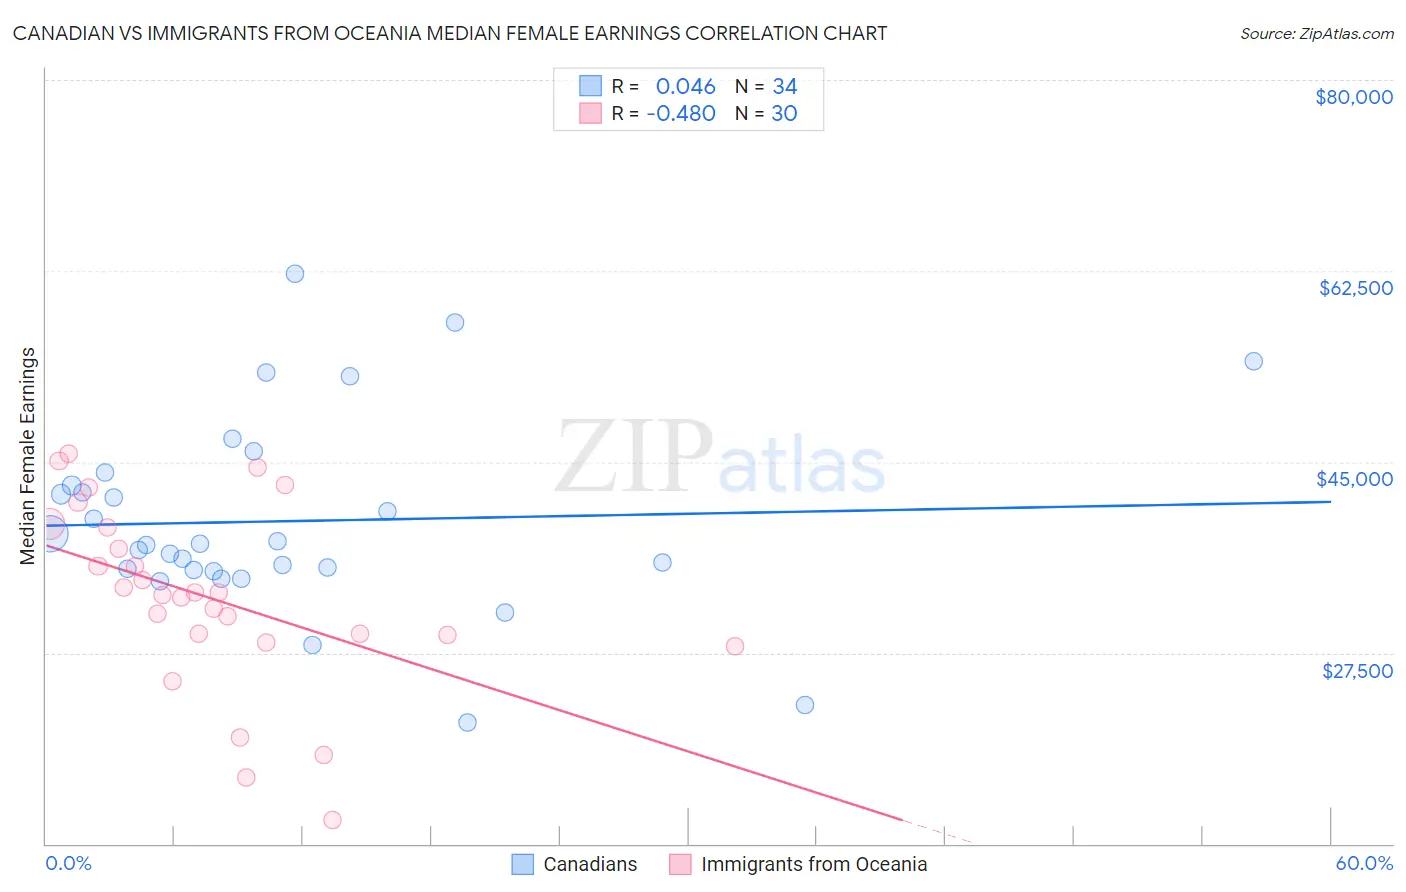
Canadian vs Immigrants from Oceania Median Female Earnings Correlation Chart
The statistical analysis conducted on geographies consisting of 437,261,658 people shows no correlation between the proportion of Canadians and median female earnings in the United States with a correlation coefficient (R) of 0.046 and weighted average of $39,724. Similarly, the statistical analysis conducted on geographies consisting of 305,406,455 people shows a moderate negative correlation between the proportion of Immigrants from Oceania and median female earnings in the United States with a correlation coefficient (R) of -0.480 and weighted average of $40,297, a difference of 1.4%.
Median Female Earnings Correlation Summary
| Measurement | Canadian | Immigrants from Oceania |
| Minimum | $21,111 | $12,128 |
| Maximum | $62,276 | $45,730 |
| Range | $41,165 | $33,602 |
| Mean | $39,561 | $32,539 |
| Median | $37,391 | $32,878 |
| Interquartile 25% (IQ1) | $35,143 | $29,179 |
| Interquartile 75% (IQ3) | $42,841 | $38,985 |
| Interquartile Range (IQR) | $7,698 | $9,806 |
| Standard Deviation (Sample) | $8,927 | $8,467 |
| Standard Deviation (Population) | $8,795 | $8,325 |
Demographics Similar to Canadians and Immigrants from Oceania by Median Female Earnings
In terms of median female earnings, the demographic groups most similar to Canadians are British ($39,772, a difference of 0.12%), Immigrants from Portugal ($39,788, a difference of 0.16%), Slovene ($39,817, a difference of 0.23%), Kenyan ($39,860, a difference of 0.34%), and Immigrants from Peru ($39,871, a difference of 0.37%). Similarly, the demographic groups most similar to Immigrants from Oceania are British West Indian ($40,299, a difference of 0.010%), Immigrants from Africa ($40,257, a difference of 0.10%), Peruvian ($40,234, a difference of 0.16%), Portuguese ($40,177, a difference of 0.30%), and Immigrants from Senegal ($40,157, a difference of 0.35%).
| Demographics | Rating | Rank | Median Female Earnings |
| British West Indians | 77.7 /100 | #153 | Good $40,299 |
| Immigrants | Oceania | 77.6 /100 | #154 | Good $40,297 |
| Immigrants | Africa | 76.2 /100 | #155 | Good $40,257 |
| Peruvians | 75.3 /100 | #156 | Good $40,234 |
| Portuguese | 73.0 /100 | #157 | Good $40,177 |
| Immigrants | Senegal | 72.2 /100 | #158 | Good $40,157 |
| Immigrants | Vietnam | 72.0 /100 | #159 | Good $40,153 |
| Inupiat | 68.9 /100 | #160 | Good $40,080 |
| Alsatians | 68.0 /100 | #161 | Good $40,060 |
| South American Indians | 66.1 /100 | #162 | Good $40,019 |
| Lebanese | 65.5 /100 | #163 | Good $40,006 |
| Immigrants | Saudi Arabia | 62.9 /100 | #164 | Good $39,952 |
| Immigrants | Bangladesh | 60.8 /100 | #165 | Good $39,910 |
| Immigrants | Ghana | 60.0 /100 | #166 | Good $39,894 |
| Luxembourgers | 59.9 /100 | #167 | Average $39,891 |
| Immigrants | Peru | 58.9 /100 | #168 | Average $39,871 |
| Kenyans | 58.4 /100 | #169 | Average $39,860 |
| Slovenes | 56.2 /100 | #170 | Average $39,817 |
| Immigrants | Portugal | 54.7 /100 | #171 | Average $39,788 |
| British | 53.8 /100 | #172 | Average $39,772 |
| Canadians | 51.4 /100 | #173 | Average $39,724 |