Chilean vs Danish Median Household Income
COMPARE
Chilean
Danish
Median Household Income
Median Household Income Comparison
Chileans
Danes
$90,605
MEDIAN HOUSEHOLD INCOME
97.2/ 100
METRIC RATING
109th/ 347
METRIC RANK
$87,676
MEDIAN HOUSEHOLD INCOME
83.9/ 100
METRIC RATING
143rd/ 347
METRIC RANK
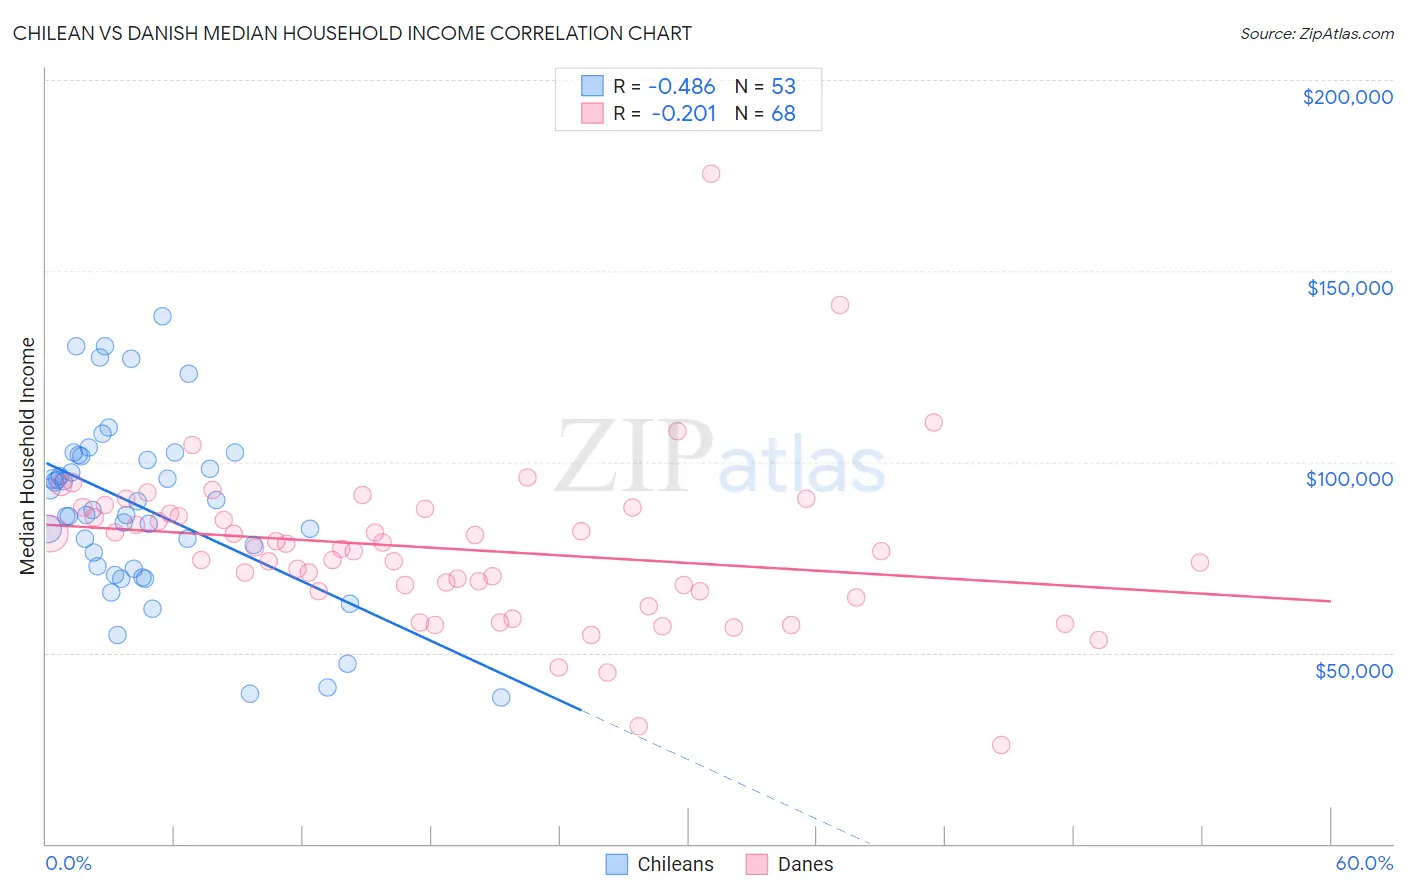
Chilean vs Danish Median Household Income Correlation Chart
The statistical analysis conducted on geographies consisting of 256,490,750 people shows a moderate negative correlation between the proportion of Chileans and median household income in the United States with a correlation coefficient (R) of -0.486 and weighted average of $90,605. Similarly, the statistical analysis conducted on geographies consisting of 473,742,440 people shows a weak negative correlation between the proportion of Danes and median household income in the United States with a correlation coefficient (R) of -0.201 and weighted average of $87,676, a difference of 3.3%.
Median Household Income Correlation Summary
| Measurement | Chilean | Danish |
| Minimum | $38,281 | $25,809 |
| Maximum | $138,054 | $175,595 |
| Range | $99,773 | $149,786 |
| Mean | $87,931 | $77,182 |
| Median | $87,519 | $76,890 |
| Interquartile 25% (IQ1) | $72,343 | $66,124 |
| Interquartile 75% (IQ3) | $101,615 | $87,030 |
| Interquartile Range (IQR) | $29,272 | $20,907 |
| Standard Deviation (Sample) | $22,824 | $21,727 |
| Standard Deviation (Population) | $22,607 | $21,566 |
Similar Demographics by Median Household Income
Demographics Similar to Chileans by Median Household Income
In terms of median household income, the demographic groups most similar to Chileans are Zimbabwean ($90,618, a difference of 0.020%), Palestinian ($90,574, a difference of 0.030%), Immigrants from Poland ($90,549, a difference of 0.060%), Croatian ($90,685, a difference of 0.090%), and Macedonian ($90,761, a difference of 0.17%).
| Demographics | Rating | Rank | Median Household Income |
| Austrians | 98.2 /100 | #102 | Exceptional $91,339 |
| Immigrants | Ukraine | 98.0 /100 | #103 | Exceptional $91,124 |
| Immigrants | Kazakhstan | 97.8 /100 | #104 | Exceptional $91,015 |
| Immigrants | Brazil | 97.7 /100 | #105 | Exceptional $90,907 |
| Macedonians | 97.4 /100 | #106 | Exceptional $90,761 |
| Croatians | 97.3 /100 | #107 | Exceptional $90,685 |
| Zimbabweans | 97.2 /100 | #108 | Exceptional $90,618 |
| Chileans | 97.2 /100 | #109 | Exceptional $90,605 |
| Palestinians | 97.1 /100 | #110 | Exceptional $90,574 |
| Immigrants | Poland | 97.1 /100 | #111 | Exceptional $90,549 |
| Northern Europeans | 96.9 /100 | #112 | Exceptional $90,446 |
| Peruvians | 96.5 /100 | #113 | Exceptional $90,261 |
| Immigrants | Northern Africa | 95.9 /100 | #114 | Exceptional $90,026 |
| Immigrants | Western Asia | 95.9 /100 | #115 | Exceptional $90,005 |
| Native Hawaiians | 95.7 /100 | #116 | Exceptional $89,919 |
Demographics Similar to Danes by Median Household Income
In terms of median household income, the demographic groups most similar to Danes are Canadian ($87,769, a difference of 0.11%), Serbian ($87,572, a difference of 0.12%), Ugandan ($87,557, a difference of 0.14%), Immigrants from Uganda ($87,553, a difference of 0.14%), and South American Indian ($87,446, a difference of 0.26%).
| Demographics | Rating | Rank | Median Household Income |
| Poles | 89.7 /100 | #136 | Excellent $88,472 |
| Sierra Leoneans | 89.6 /100 | #137 | Excellent $88,463 |
| Arabs | 89.2 /100 | #138 | Excellent $88,398 |
| Immigrants | Chile | 89.2 /100 | #139 | Excellent $88,388 |
| Lebanese | 87.2 /100 | #140 | Excellent $88,091 |
| Immigrants | Morocco | 86.0 /100 | #141 | Excellent $87,930 |
| Canadians | 84.7 /100 | #142 | Excellent $87,769 |
| Danes | 83.9 /100 | #143 | Excellent $87,676 |
| Serbians | 83.0 /100 | #144 | Excellent $87,572 |
| Ugandans | 82.9 /100 | #145 | Excellent $87,557 |
| Immigrants | Uganda | 82.8 /100 | #146 | Excellent $87,553 |
| South American Indians | 81.8 /100 | #147 | Excellent $87,446 |
| Costa Ricans | 80.0 /100 | #148 | Excellent $87,262 |
| Immigrants | Nepal | 77.7 /100 | #149 | Good $87,046 |
| Basques | 77.2 /100 | #150 | Good $87,001 |