Immigrants from Barbados vs Danish Median Household Income
COMPARE
Immigrants from Barbados
Danish
Median Household Income
Median Household Income Comparison
Immigrants from Barbados
Danes
$78,989
MEDIAN HOUSEHOLD INCOME
1.9/ 100
METRIC RATING
243rd/ 347
METRIC RANK
$87,676
MEDIAN HOUSEHOLD INCOME
83.9/ 100
METRIC RATING
143rd/ 347
METRIC RANK
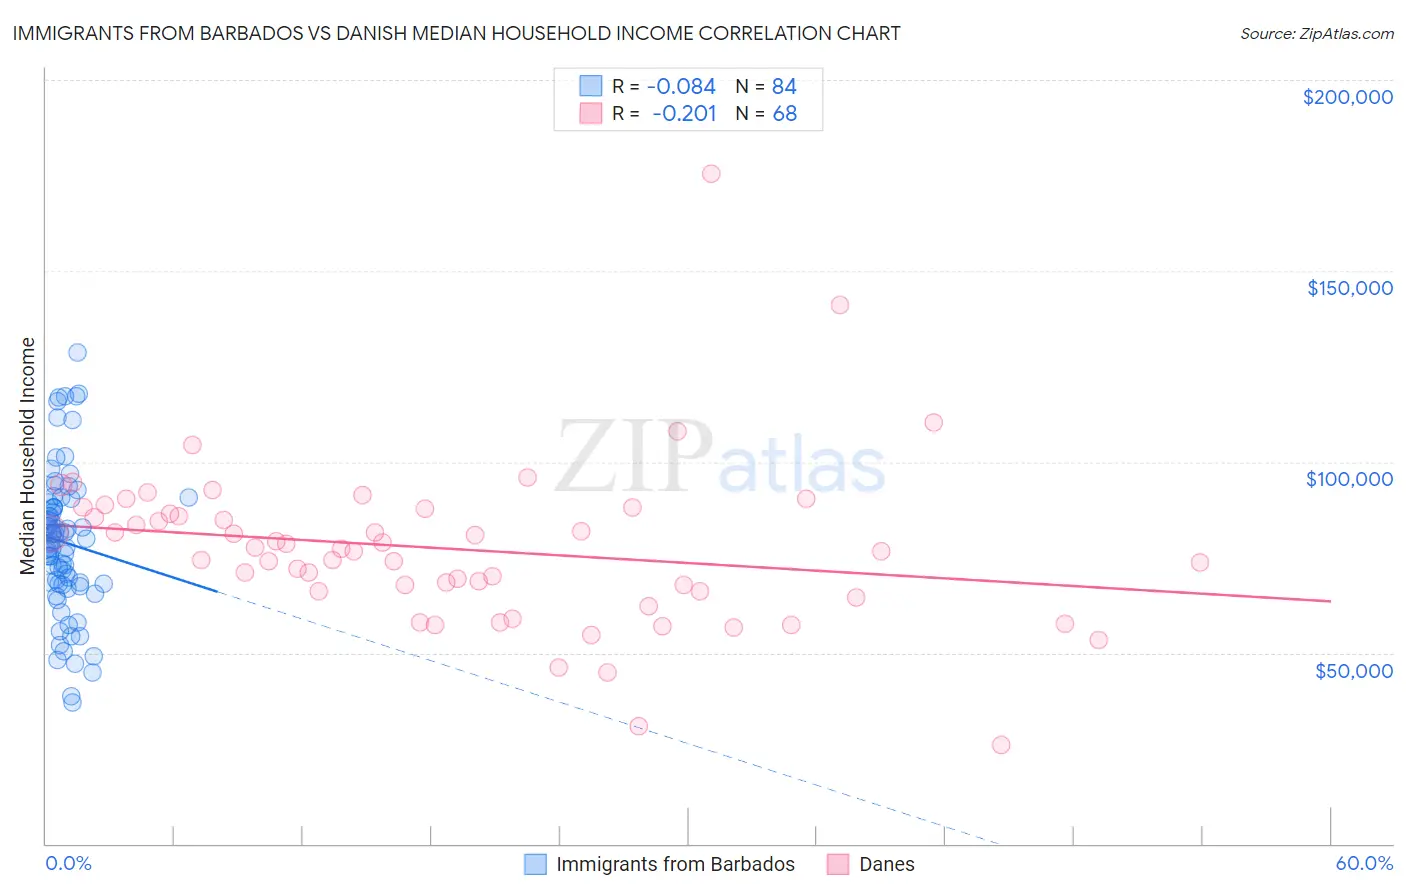
Immigrants from Barbados vs Danish Median Household Income Correlation Chart
The statistical analysis conducted on geographies consisting of 112,738,981 people shows a slight negative correlation between the proportion of Immigrants from Barbados and median household income in the United States with a correlation coefficient (R) of -0.084 and weighted average of $78,989. Similarly, the statistical analysis conducted on geographies consisting of 473,742,440 people shows a weak negative correlation between the proportion of Danes and median household income in the United States with a correlation coefficient (R) of -0.201 and weighted average of $87,676, a difference of 11.0%.
Median Household Income Correlation Summary
| Measurement | Immigrants from Barbados | Danish |
| Minimum | $37,105 | $25,809 |
| Maximum | $128,750 | $175,595 |
| Range | $91,645 | $149,786 |
| Mean | $78,963 | $77,182 |
| Median | $79,093 | $76,890 |
| Interquartile 25% (IQ1) | $67,974 | $66,124 |
| Interquartile 75% (IQ3) | $88,607 | $87,030 |
| Interquartile Range (IQR) | $20,633 | $20,907 |
| Standard Deviation (Sample) | $18,879 | $21,727 |
| Standard Deviation (Population) | $18,767 | $21,566 |
Similar Demographics by Median Household Income
Demographics Similar to Immigrants from Barbados by Median Household Income
In terms of median household income, the demographic groups most similar to Immigrants from Barbados are Marshallese ($78,930, a difference of 0.080%), Immigrants from Sudan ($79,103, a difference of 0.14%), Inupiat ($78,841, a difference of 0.19%), Central American ($78,803, a difference of 0.24%), and Immigrants from Burma/Myanmar ($78,682, a difference of 0.39%).
| Demographics | Rating | Rank | Median Household Income |
| Immigrants | Bosnia and Herzegovina | 3.4 /100 | #236 | Tragic $79,888 |
| Nicaraguans | 3.1 /100 | #237 | Tragic $79,737 |
| Barbadians | 3.0 /100 | #238 | Tragic $79,664 |
| Alaska Natives | 2.7 /100 | #239 | Tragic $79,509 |
| Immigrants | Western Africa | 2.7 /100 | #240 | Tragic $79,490 |
| Immigrants | Nonimmigrants | 2.6 /100 | #241 | Tragic $79,429 |
| Immigrants | Sudan | 2.1 /100 | #242 | Tragic $79,103 |
| Immigrants | Barbados | 1.9 /100 | #243 | Tragic $78,989 |
| Marshallese | 1.9 /100 | #244 | Tragic $78,930 |
| Inupiat | 1.8 /100 | #245 | Tragic $78,841 |
| Central Americans | 1.7 /100 | #246 | Tragic $78,803 |
| Immigrants | Burma/Myanmar | 1.6 /100 | #247 | Tragic $78,682 |
| Sudanese | 1.5 /100 | #248 | Tragic $78,529 |
| West Indians | 1.4 /100 | #249 | Tragic $78,455 |
| Immigrants | Laos | 1.3 /100 | #250 | Tragic $78,327 |
Demographics Similar to Danes by Median Household Income
In terms of median household income, the demographic groups most similar to Danes are Canadian ($87,769, a difference of 0.11%), Serbian ($87,572, a difference of 0.12%), Ugandan ($87,557, a difference of 0.14%), Immigrants from Uganda ($87,553, a difference of 0.14%), and South American Indian ($87,446, a difference of 0.26%).
| Demographics | Rating | Rank | Median Household Income |
| Poles | 89.7 /100 | #136 | Excellent $88,472 |
| Sierra Leoneans | 89.6 /100 | #137 | Excellent $88,463 |
| Arabs | 89.2 /100 | #138 | Excellent $88,398 |
| Immigrants | Chile | 89.2 /100 | #139 | Excellent $88,388 |
| Lebanese | 87.2 /100 | #140 | Excellent $88,091 |
| Immigrants | Morocco | 86.0 /100 | #141 | Excellent $87,930 |
| Canadians | 84.7 /100 | #142 | Excellent $87,769 |
| Danes | 83.9 /100 | #143 | Excellent $87,676 |
| Serbians | 83.0 /100 | #144 | Excellent $87,572 |
| Ugandans | 82.9 /100 | #145 | Excellent $87,557 |
| Immigrants | Uganda | 82.8 /100 | #146 | Excellent $87,553 |
| South American Indians | 81.8 /100 | #147 | Excellent $87,446 |
| Costa Ricans | 80.0 /100 | #148 | Excellent $87,262 |
| Immigrants | Nepal | 77.7 /100 | #149 | Good $87,046 |
| Basques | 77.2 /100 | #150 | Good $87,001 |