Yaqui vs Danish Median Household Income
COMPARE
Yaqui
Danish
Median Household Income
Median Household Income Comparison
Yaqui
Danes
$74,596
MEDIAN HOUSEHOLD INCOME
0.1/ 100
METRIC RATING
284th/ 347
METRIC RANK
$87,676
MEDIAN HOUSEHOLD INCOME
83.9/ 100
METRIC RATING
143rd/ 347
METRIC RANK
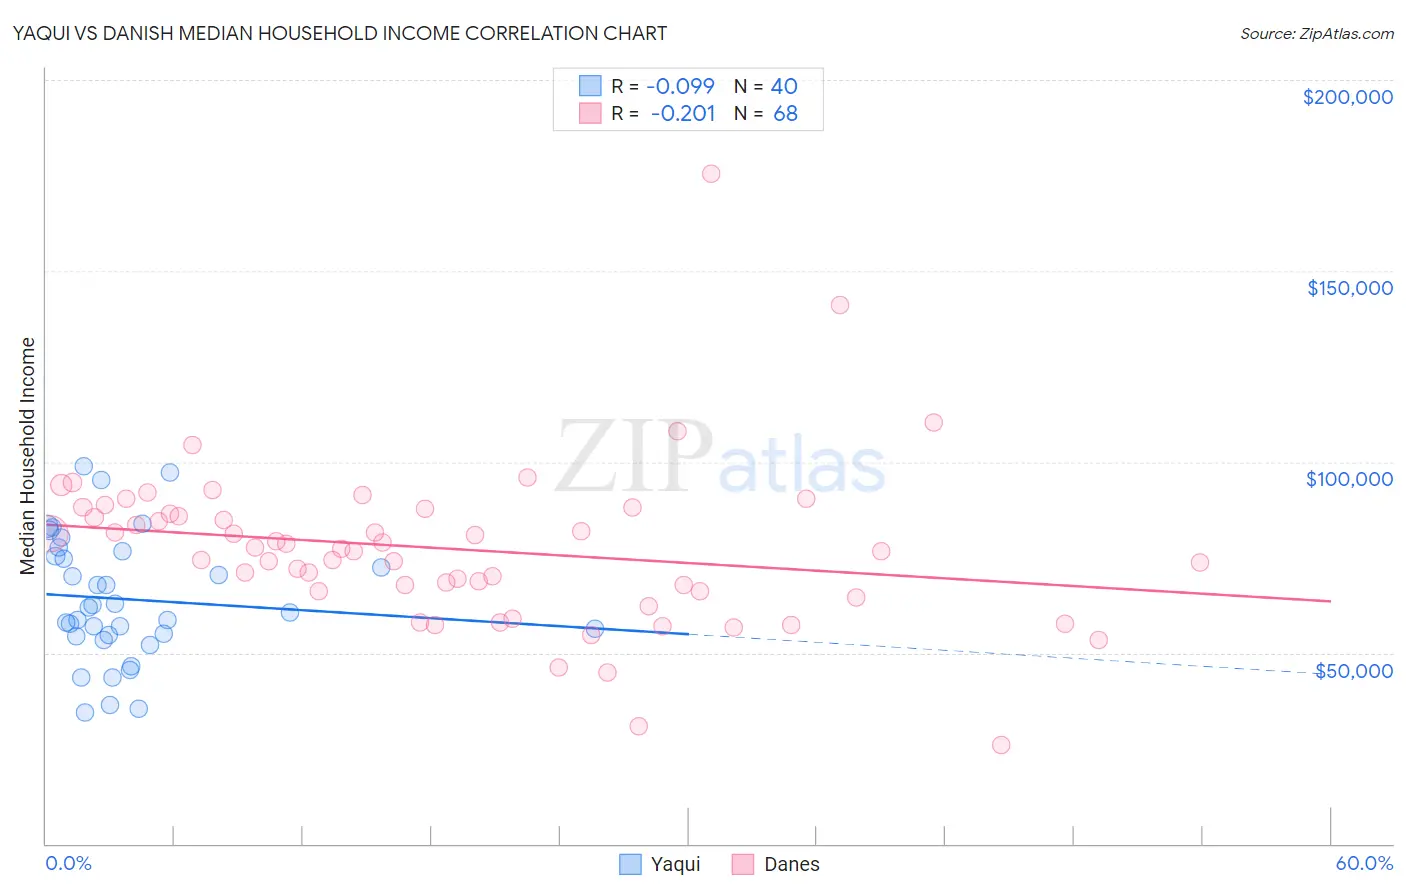
Yaqui vs Danish Median Household Income Correlation Chart
The statistical analysis conducted on geographies consisting of 107,719,305 people shows a slight negative correlation between the proportion of Yaqui and median household income in the United States with a correlation coefficient (R) of -0.099 and weighted average of $74,596. Similarly, the statistical analysis conducted on geographies consisting of 473,742,440 people shows a weak negative correlation between the proportion of Danes and median household income in the United States with a correlation coefficient (R) of -0.201 and weighted average of $87,676, a difference of 17.5%.
Median Household Income Correlation Summary
| Measurement | Yaqui | Danish |
| Minimum | $34,415 | $25,809 |
| Maximum | $98,754 | $175,595 |
| Range | $64,339 | $149,786 |
| Mean | $64,033 | $77,182 |
| Median | $61,231 | $76,890 |
| Interquartile 25% (IQ1) | $54,573 | $66,124 |
| Interquartile 75% (IQ3) | $75,863 | $87,030 |
| Interquartile Range (IQR) | $21,290 | $20,907 |
| Standard Deviation (Sample) | $16,401 | $21,727 |
| Standard Deviation (Population) | $16,195 | $21,566 |
Similar Demographics by Median Household Income
Demographics Similar to Yaqui by Median Household Income
In terms of median household income, the demographic groups most similar to Yaqui are Cree ($74,685, a difference of 0.12%), Mexican ($74,399, a difference of 0.26%), Central American Indian ($74,847, a difference of 0.34%), Immigrants from Liberia ($74,896, a difference of 0.40%), and Immigrants from Somalia ($74,300, a difference of 0.40%).
| Demographics | Rating | Rank | Median Household Income |
| Spanish Americans | 0.2 /100 | #277 | Tragic $75,386 |
| Osage | 0.2 /100 | #278 | Tragic $75,240 |
| Immigrants | Guatemala | 0.2 /100 | #279 | Tragic $75,123 |
| Senegalese | 0.2 /100 | #280 | Tragic $74,999 |
| Immigrants | Liberia | 0.1 /100 | #281 | Tragic $74,896 |
| Central American Indians | 0.1 /100 | #282 | Tragic $74,847 |
| Cree | 0.1 /100 | #283 | Tragic $74,685 |
| Yaqui | 0.1 /100 | #284 | Tragic $74,596 |
| Mexicans | 0.1 /100 | #285 | Tragic $74,399 |
| Immigrants | Somalia | 0.1 /100 | #286 | Tragic $74,300 |
| Iroquois | 0.1 /100 | #287 | Tragic $74,279 |
| Immigrants | Central America | 0.1 /100 | #288 | Tragic $74,217 |
| Fijians | 0.1 /100 | #289 | Tragic $74,205 |
| Bangladeshis | 0.1 /100 | #290 | Tragic $74,112 |
| Hispanics or Latinos | 0.1 /100 | #291 | Tragic $73,823 |
Demographics Similar to Danes by Median Household Income
In terms of median household income, the demographic groups most similar to Danes are Canadian ($87,769, a difference of 0.11%), Serbian ($87,572, a difference of 0.12%), Ugandan ($87,557, a difference of 0.14%), Immigrants from Uganda ($87,553, a difference of 0.14%), and South American Indian ($87,446, a difference of 0.26%).
| Demographics | Rating | Rank | Median Household Income |
| Poles | 89.7 /100 | #136 | Excellent $88,472 |
| Sierra Leoneans | 89.6 /100 | #137 | Excellent $88,463 |
| Arabs | 89.2 /100 | #138 | Excellent $88,398 |
| Immigrants | Chile | 89.2 /100 | #139 | Excellent $88,388 |
| Lebanese | 87.2 /100 | #140 | Excellent $88,091 |
| Immigrants | Morocco | 86.0 /100 | #141 | Excellent $87,930 |
| Canadians | 84.7 /100 | #142 | Excellent $87,769 |
| Danes | 83.9 /100 | #143 | Excellent $87,676 |
| Serbians | 83.0 /100 | #144 | Excellent $87,572 |
| Ugandans | 82.9 /100 | #145 | Excellent $87,557 |
| Immigrants | Uganda | 82.8 /100 | #146 | Excellent $87,553 |
| South American Indians | 81.8 /100 | #147 | Excellent $87,446 |
| Costa Ricans | 80.0 /100 | #148 | Excellent $87,262 |
| Immigrants | Nepal | 77.7 /100 | #149 | Good $87,046 |
| Basques | 77.2 /100 | #150 | Good $87,001 |