Chilean vs Immigrants from Sweden Median Household Income
COMPARE
Chilean
Immigrants from Sweden
Median Household Income
Median Household Income Comparison
Chileans
Immigrants from Sweden
$90,605
MEDIAN HOUSEHOLD INCOME
97.2/ 100
METRIC RATING
109th/ 347
METRIC RANK
$100,699
MEDIAN HOUSEHOLD INCOME
100.0/ 100
METRIC RATING
25th/ 347
METRIC RANK
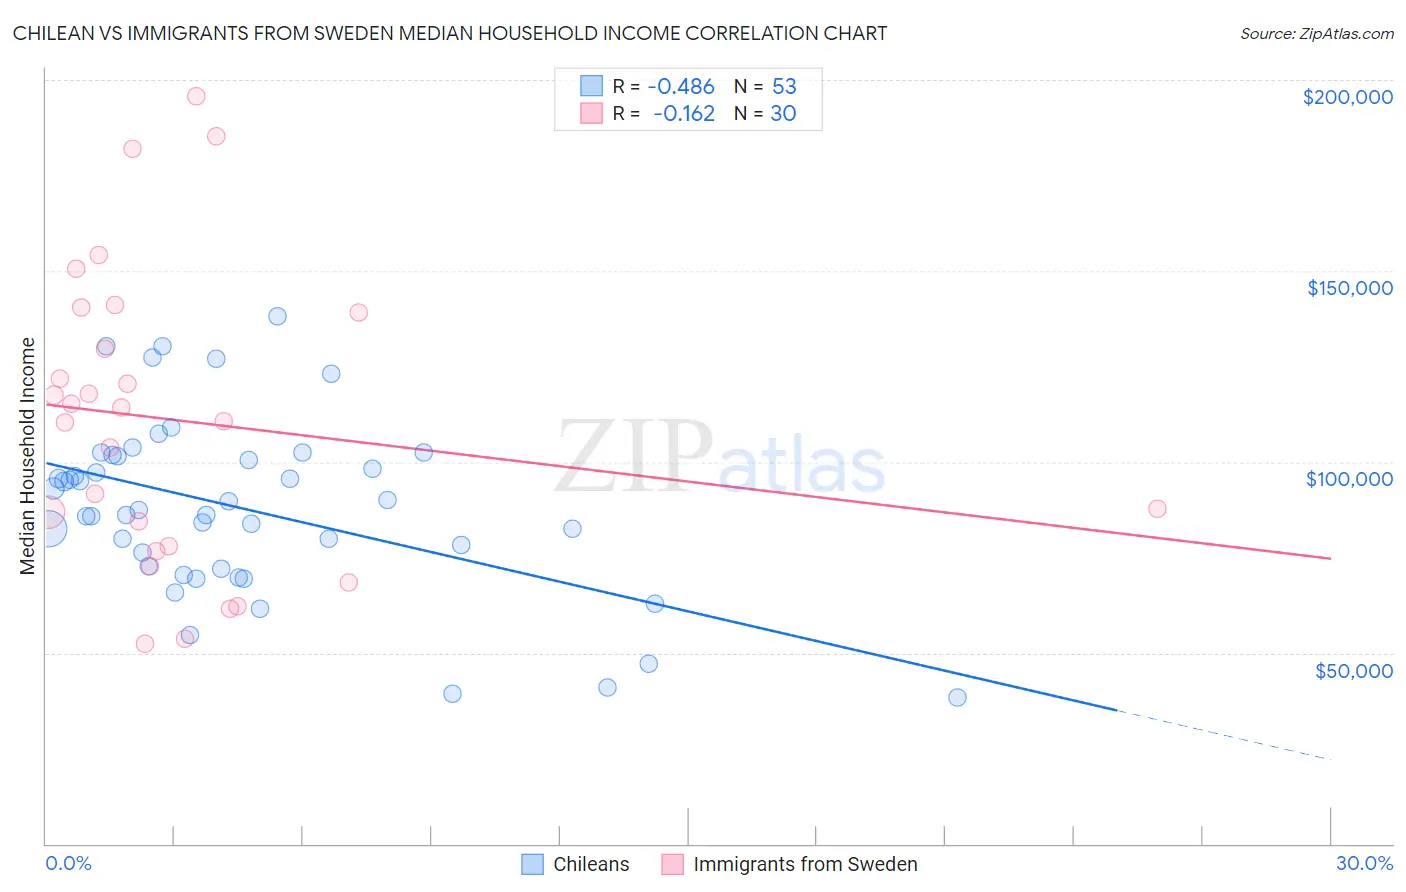
Chilean vs Immigrants from Sweden Median Household Income Correlation Chart
The statistical analysis conducted on geographies consisting of 256,490,750 people shows a moderate negative correlation between the proportion of Chileans and median household income in the United States with a correlation coefficient (R) of -0.486 and weighted average of $90,605. Similarly, the statistical analysis conducted on geographies consisting of 164,698,337 people shows a poor negative correlation between the proportion of Immigrants from Sweden and median household income in the United States with a correlation coefficient (R) of -0.162 and weighted average of $100,699, a difference of 11.1%.
Median Household Income Correlation Summary
| Measurement | Chilean | Immigrants from Sweden |
| Minimum | $38,281 | $52,323 |
| Maximum | $138,054 | $195,586 |
| Range | $99,773 | $143,263 |
| Mean | $87,931 | $110,867 |
| Median | $87,519 | $112,526 |
| Interquartile 25% (IQ1) | $72,343 | $78,036 |
| Interquartile 75% (IQ3) | $101,615 | $139,219 |
| Interquartile Range (IQR) | $29,272 | $61,183 |
| Standard Deviation (Sample) | $22,824 | $38,839 |
| Standard Deviation (Population) | $22,607 | $38,186 |
Similar Demographics by Median Household Income
Demographics Similar to Chileans by Median Household Income
In terms of median household income, the demographic groups most similar to Chileans are Zimbabwean ($90,618, a difference of 0.020%), Palestinian ($90,574, a difference of 0.030%), Immigrants from Poland ($90,549, a difference of 0.060%), Croatian ($90,685, a difference of 0.090%), and Macedonian ($90,761, a difference of 0.17%).
| Demographics | Rating | Rank | Median Household Income |
| Austrians | 98.2 /100 | #102 | Exceptional $91,339 |
| Immigrants | Ukraine | 98.0 /100 | #103 | Exceptional $91,124 |
| Immigrants | Kazakhstan | 97.8 /100 | #104 | Exceptional $91,015 |
| Immigrants | Brazil | 97.7 /100 | #105 | Exceptional $90,907 |
| Macedonians | 97.4 /100 | #106 | Exceptional $90,761 |
| Croatians | 97.3 /100 | #107 | Exceptional $90,685 |
| Zimbabweans | 97.2 /100 | #108 | Exceptional $90,618 |
| Chileans | 97.2 /100 | #109 | Exceptional $90,605 |
| Palestinians | 97.1 /100 | #110 | Exceptional $90,574 |
| Immigrants | Poland | 97.1 /100 | #111 | Exceptional $90,549 |
| Northern Europeans | 96.9 /100 | #112 | Exceptional $90,446 |
| Peruvians | 96.5 /100 | #113 | Exceptional $90,261 |
| Immigrants | Northern Africa | 95.9 /100 | #114 | Exceptional $90,026 |
| Immigrants | Western Asia | 95.9 /100 | #115 | Exceptional $90,005 |
| Native Hawaiians | 95.7 /100 | #116 | Exceptional $89,919 |
Demographics Similar to Immigrants from Sweden by Median Household Income
In terms of median household income, the demographic groups most similar to Immigrants from Sweden are Immigrants from Japan ($100,711, a difference of 0.010%), Immigrants from Belgium ($100,306, a difference of 0.39%), Bhutanese ($100,151, a difference of 0.55%), Immigrants from Bolivia ($101,394, a difference of 0.69%), and Immigrants from Sri Lanka ($99,943, a difference of 0.76%).
| Demographics | Rating | Rank | Median Household Income |
| Cypriots | 100.0 /100 | #18 | Exceptional $102,843 |
| Immigrants | Australia | 100.0 /100 | #19 | Exceptional $102,562 |
| Bolivians | 100.0 /100 | #20 | Exceptional $102,195 |
| Eastern Europeans | 100.0 /100 | #21 | Exceptional $101,781 |
| Asians | 100.0 /100 | #22 | Exceptional $101,681 |
| Immigrants | Bolivia | 100.0 /100 | #23 | Exceptional $101,394 |
| Immigrants | Japan | 100.0 /100 | #24 | Exceptional $100,711 |
| Immigrants | Sweden | 100.0 /100 | #25 | Exceptional $100,699 |
| Immigrants | Belgium | 100.0 /100 | #26 | Exceptional $100,306 |
| Bhutanese | 100.0 /100 | #27 | Exceptional $100,151 |
| Immigrants | Sri Lanka | 100.0 /100 | #28 | Exceptional $99,943 |
| Immigrants | Asia | 100.0 /100 | #29 | Exceptional $99,933 |
| Immigrants | Northern Europe | 100.0 /100 | #30 | Exceptional $99,813 |
| Turks | 100.0 /100 | #31 | Exceptional $99,389 |
| Immigrants | Denmark | 100.0 /100 | #32 | Exceptional $98,510 |