Chilean vs Immigrants from Southern Europe Median Household Income
COMPARE
Chilean
Immigrants from Southern Europe
Median Household Income
Median Household Income Comparison
Chileans
Immigrants from Southern Europe
$90,605
MEDIAN HOUSEHOLD INCOME
97.2/ 100
METRIC RATING
109th/ 347
METRIC RANK
$91,605
MEDIAN HOUSEHOLD INCOME
98.5/ 100
METRIC RATING
98th/ 347
METRIC RANK
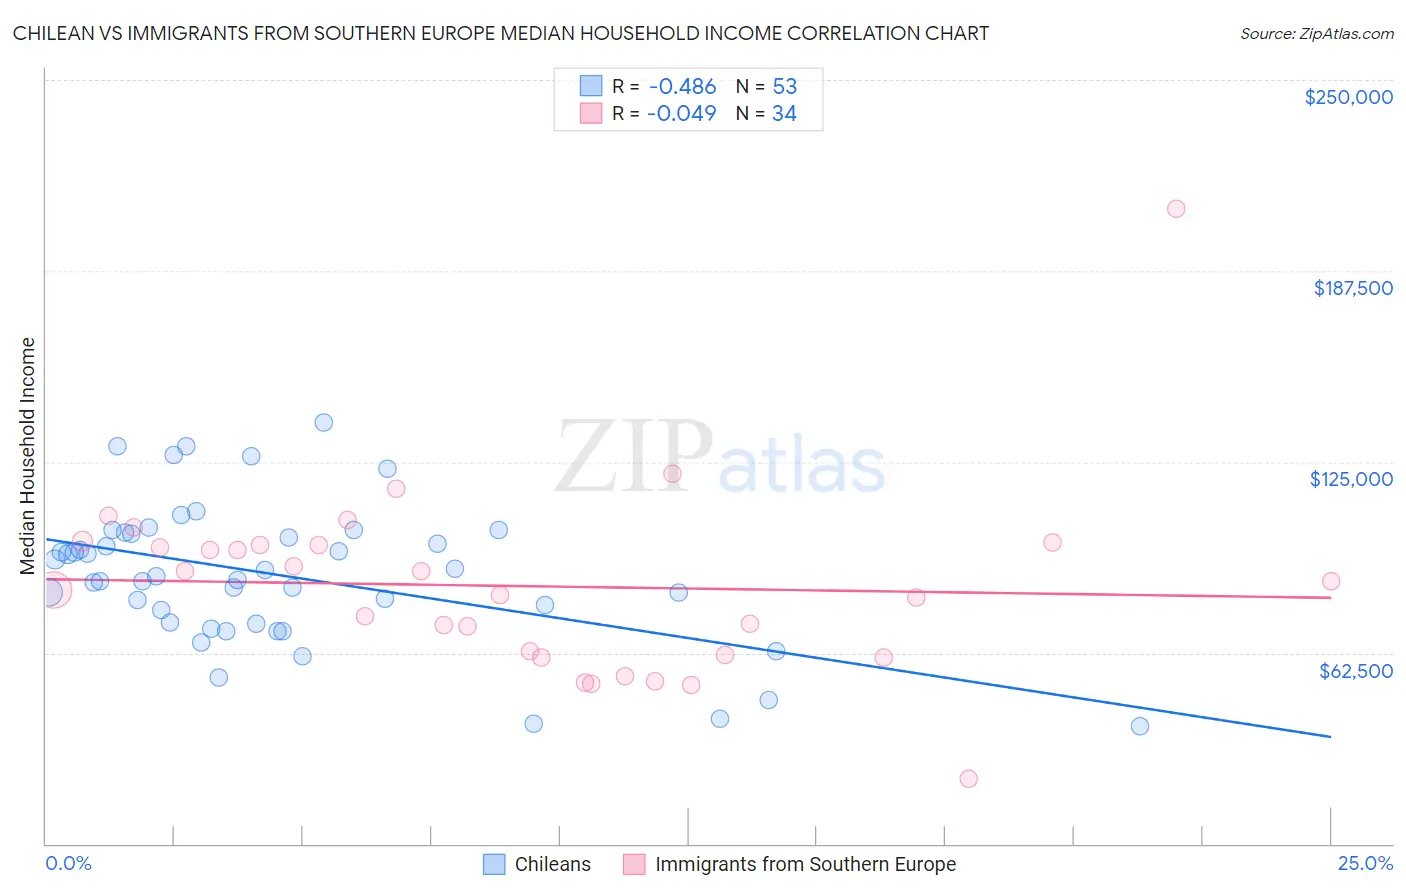
Chilean vs Immigrants from Southern Europe Median Household Income Correlation Chart
The statistical analysis conducted on geographies consisting of 256,490,750 people shows a moderate negative correlation between the proportion of Chileans and median household income in the United States with a correlation coefficient (R) of -0.486 and weighted average of $90,605. Similarly, the statistical analysis conducted on geographies consisting of 402,553,568 people shows no correlation between the proportion of Immigrants from Southern Europe and median household income in the United States with a correlation coefficient (R) of -0.049 and weighted average of $91,605, a difference of 1.1%.
Median Household Income Correlation Summary
| Measurement | Chilean | Immigrants from Southern Europe |
| Minimum | $38,281 | $21,344 |
| Maximum | $138,054 | $207,878 |
| Range | $99,773 | $186,534 |
| Mean | $87,931 | $84,332 |
| Median | $87,519 | $84,460 |
| Interquartile 25% (IQ1) | $72,343 | $61,987 |
| Interquartile 75% (IQ3) | $101,615 | $97,991 |
| Interquartile Range (IQR) | $29,272 | $36,004 |
| Standard Deviation (Sample) | $22,824 | $31,079 |
| Standard Deviation (Population) | $22,607 | $30,619 |
Demographics Similar to Chileans and Immigrants from Southern Europe by Median Household Income
In terms of median household income, the demographic groups most similar to Chileans are Zimbabwean ($90,618, a difference of 0.020%), Palestinian ($90,574, a difference of 0.030%), Immigrants from Poland ($90,549, a difference of 0.060%), Croatian ($90,685, a difference of 0.090%), and Macedonian ($90,761, a difference of 0.17%). Similarly, the demographic groups most similar to Immigrants from Southern Europe are Immigrants from South Eastern Asia ($91,541, a difference of 0.070%), Immigrants from Serbia ($91,730, a difference of 0.14%), Ukrainian ($91,456, a difference of 0.16%), Immigrants from Moldova ($91,446, a difference of 0.17%), and Jordanian ($91,794, a difference of 0.21%).
| Demographics | Rating | Rank | Median Household Income |
| Immigrants | Lebanon | 98.7 /100 | #93 | Exceptional $91,887 |
| Immigrants | North America | 98.7 /100 | #94 | Exceptional $91,860 |
| Armenians | 98.7 /100 | #95 | Exceptional $91,807 |
| Jordanians | 98.7 /100 | #96 | Exceptional $91,794 |
| Immigrants | Serbia | 98.6 /100 | #97 | Exceptional $91,730 |
| Immigrants | Southern Europe | 98.5 /100 | #98 | Exceptional $91,605 |
| Immigrants | South Eastern Asia | 98.4 /100 | #99 | Exceptional $91,541 |
| Ukrainians | 98.3 /100 | #100 | Exceptional $91,456 |
| Immigrants | Moldova | 98.3 /100 | #101 | Exceptional $91,446 |
| Austrians | 98.2 /100 | #102 | Exceptional $91,339 |
| Immigrants | Ukraine | 98.0 /100 | #103 | Exceptional $91,124 |
| Immigrants | Kazakhstan | 97.8 /100 | #104 | Exceptional $91,015 |
| Immigrants | Brazil | 97.7 /100 | #105 | Exceptional $90,907 |
| Macedonians | 97.4 /100 | #106 | Exceptional $90,761 |
| Croatians | 97.3 /100 | #107 | Exceptional $90,685 |
| Zimbabweans | 97.2 /100 | #108 | Exceptional $90,618 |
| Chileans | 97.2 /100 | #109 | Exceptional $90,605 |
| Palestinians | 97.1 /100 | #110 | Exceptional $90,574 |
| Immigrants | Poland | 97.1 /100 | #111 | Exceptional $90,549 |
| Northern Europeans | 96.9 /100 | #112 | Exceptional $90,446 |
| Peruvians | 96.5 /100 | #113 | Exceptional $90,261 |