Cajun vs Danish Median Household Income
COMPARE
Cajun
Danish
Median Household Income
Median Household Income Comparison
Cajuns
Danes
$70,605
MEDIAN HOUSEHOLD INCOME
0.0/ 100
METRIC RATING
317th/ 347
METRIC RANK
$87,676
MEDIAN HOUSEHOLD INCOME
83.9/ 100
METRIC RATING
143rd/ 347
METRIC RANK
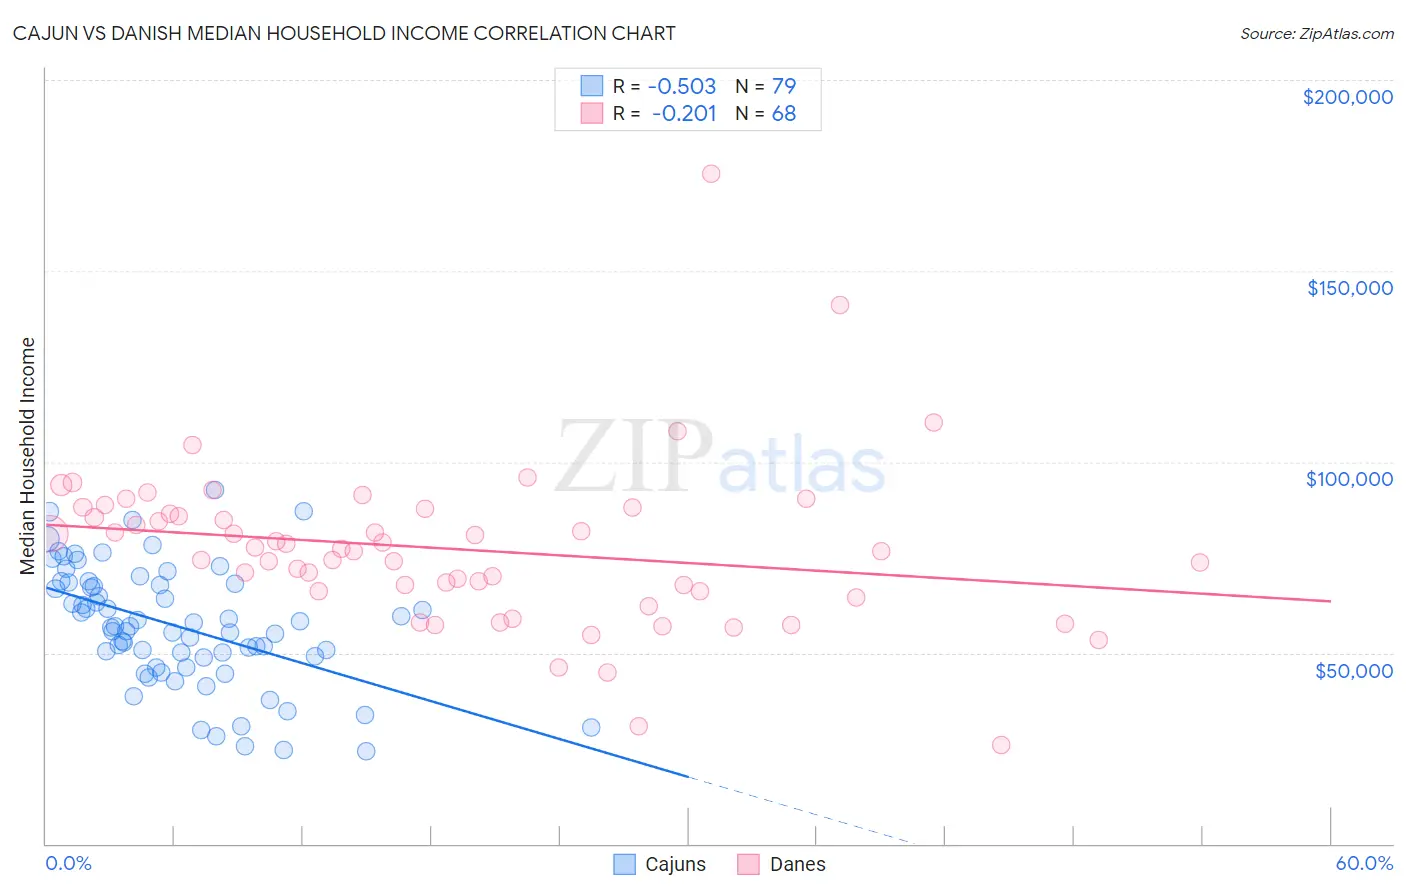
Cajun vs Danish Median Household Income Correlation Chart
The statistical analysis conducted on geographies consisting of 149,670,755 people shows a substantial negative correlation between the proportion of Cajuns and median household income in the United States with a correlation coefficient (R) of -0.503 and weighted average of $70,605. Similarly, the statistical analysis conducted on geographies consisting of 473,742,440 people shows a weak negative correlation between the proportion of Danes and median household income in the United States with a correlation coefficient (R) of -0.201 and weighted average of $87,676, a difference of 24.2%.
Median Household Income Correlation Summary
| Measurement | Cajun | Danish |
| Minimum | $24,375 | $25,809 |
| Maximum | $92,480 | $175,595 |
| Range | $68,105 | $149,786 |
| Mean | $57,001 | $77,182 |
| Median | $56,809 | $76,890 |
| Interquartile 25% (IQ1) | $48,865 | $66,124 |
| Interquartile 75% (IQ3) | $68,083 | $87,030 |
| Interquartile Range (IQR) | $19,218 | $20,907 |
| Standard Deviation (Sample) | $15,446 | $21,727 |
| Standard Deviation (Population) | $15,348 | $21,566 |
Similar Demographics by Median Household Income
Demographics Similar to Cajuns by Median Household Income
In terms of median household income, the demographic groups most similar to Cajuns are Chippewa ($70,539, a difference of 0.090%), Apache ($70,927, a difference of 0.46%), Ottawa ($70,984, a difference of 0.54%), Immigrants from Dominican Republic ($70,208, a difference of 0.56%), and Colville ($70,094, a difference of 0.73%).
| Demographics | Rating | Rank | Median Household Income |
| U.S. Virgin Islanders | 0.0 /100 | #310 | Tragic $71,853 |
| Immigrants | Zaire | 0.0 /100 | #311 | Tragic $71,801 |
| Immigrants | Honduras | 0.0 /100 | #312 | Tragic $71,452 |
| Immigrants | Bahamas | 0.0 /100 | #313 | Tragic $71,349 |
| Dominicans | 0.0 /100 | #314 | Tragic $71,302 |
| Ottawa | 0.0 /100 | #315 | Tragic $70,984 |
| Apache | 0.0 /100 | #316 | Tragic $70,927 |
| Cajuns | 0.0 /100 | #317 | Tragic $70,605 |
| Chippewa | 0.0 /100 | #318 | Tragic $70,539 |
| Immigrants | Dominican Republic | 0.0 /100 | #319 | Tragic $70,208 |
| Colville | 0.0 /100 | #320 | Tragic $70,094 |
| Chickasaw | 0.0 /100 | #321 | Tragic $70,005 |
| Choctaw | 0.0 /100 | #322 | Tragic $69,947 |
| Bahamians | 0.0 /100 | #323 | Tragic $69,726 |
| Yup'ik | 0.0 /100 | #324 | Tragic $69,695 |
Demographics Similar to Danes by Median Household Income
In terms of median household income, the demographic groups most similar to Danes are Canadian ($87,769, a difference of 0.11%), Serbian ($87,572, a difference of 0.12%), Ugandan ($87,557, a difference of 0.14%), Immigrants from Uganda ($87,553, a difference of 0.14%), and South American Indian ($87,446, a difference of 0.26%).
| Demographics | Rating | Rank | Median Household Income |
| Poles | 89.7 /100 | #136 | Excellent $88,472 |
| Sierra Leoneans | 89.6 /100 | #137 | Excellent $88,463 |
| Arabs | 89.2 /100 | #138 | Excellent $88,398 |
| Immigrants | Chile | 89.2 /100 | #139 | Excellent $88,388 |
| Lebanese | 87.2 /100 | #140 | Excellent $88,091 |
| Immigrants | Morocco | 86.0 /100 | #141 | Excellent $87,930 |
| Canadians | 84.7 /100 | #142 | Excellent $87,769 |
| Danes | 83.9 /100 | #143 | Excellent $87,676 |
| Serbians | 83.0 /100 | #144 | Excellent $87,572 |
| Ugandans | 82.9 /100 | #145 | Excellent $87,557 |
| Immigrants | Uganda | 82.8 /100 | #146 | Excellent $87,553 |
| South American Indians | 81.8 /100 | #147 | Excellent $87,446 |
| Costa Ricans | 80.0 /100 | #148 | Excellent $87,262 |
| Immigrants | Nepal | 77.7 /100 | #149 | Good $87,046 |
| Basques | 77.2 /100 | #150 | Good $87,001 |