Immigrants from Moldova vs Danish Median Household Income
COMPARE
Immigrants from Moldova
Danish
Median Household Income
Median Household Income Comparison
Immigrants from Moldova
Danes
$91,446
MEDIAN HOUSEHOLD INCOME
98.3/ 100
METRIC RATING
101st/ 347
METRIC RANK
$87,676
MEDIAN HOUSEHOLD INCOME
83.9/ 100
METRIC RATING
143rd/ 347
METRIC RANK
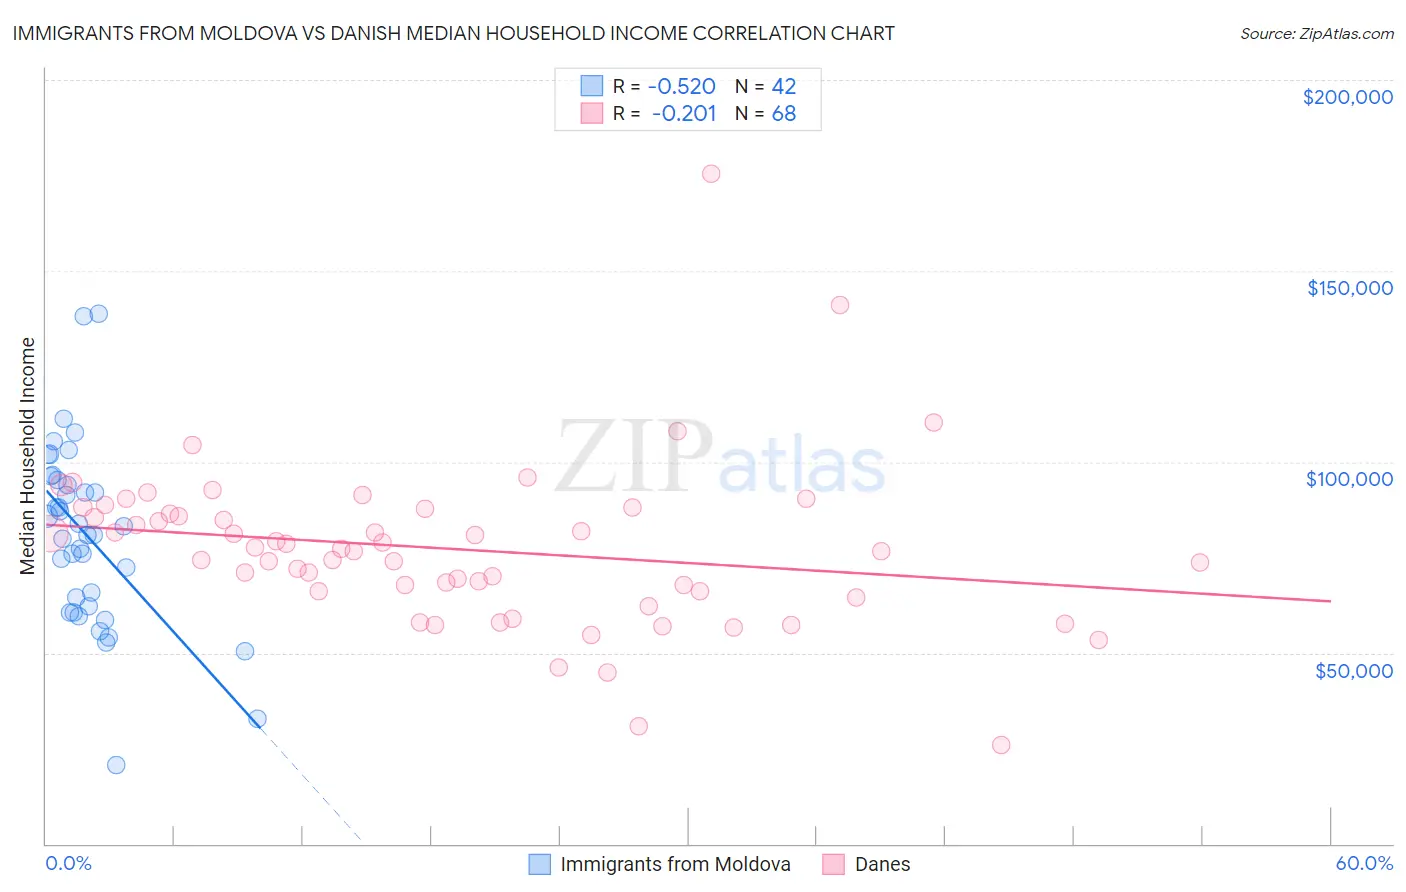
Immigrants from Moldova vs Danish Median Household Income Correlation Chart
The statistical analysis conducted on geographies consisting of 124,363,535 people shows a substantial negative correlation between the proportion of Immigrants from Moldova and median household income in the United States with a correlation coefficient (R) of -0.520 and weighted average of $91,446. Similarly, the statistical analysis conducted on geographies consisting of 473,742,440 people shows a weak negative correlation between the proportion of Danes and median household income in the United States with a correlation coefficient (R) of -0.201 and weighted average of $87,676, a difference of 4.3%.
Median Household Income Correlation Summary
| Measurement | Immigrants from Moldova | Danish |
| Minimum | $20,699 | $25,809 |
| Maximum | $138,879 | $175,595 |
| Range | $118,180 | $149,786 |
| Mean | $80,883 | $77,182 |
| Median | $82,096 | $76,890 |
| Interquartile 25% (IQ1) | $62,083 | $66,124 |
| Interquartile 75% (IQ3) | $95,143 | $87,030 |
| Interquartile Range (IQR) | $33,060 | $20,907 |
| Standard Deviation (Sample) | $23,912 | $21,727 |
| Standard Deviation (Population) | $23,626 | $21,566 |
Similar Demographics by Median Household Income
Demographics Similar to Immigrants from Moldova by Median Household Income
In terms of median household income, the demographic groups most similar to Immigrants from Moldova are Ukrainian ($91,456, a difference of 0.010%), Immigrants from South Eastern Asia ($91,541, a difference of 0.10%), Austrian ($91,339, a difference of 0.12%), Immigrants from Southern Europe ($91,605, a difference of 0.17%), and Immigrants from Serbia ($91,730, a difference of 0.31%).
| Demographics | Rating | Rank | Median Household Income |
| Immigrants | North America | 98.7 /100 | #94 | Exceptional $91,860 |
| Armenians | 98.7 /100 | #95 | Exceptional $91,807 |
| Jordanians | 98.7 /100 | #96 | Exceptional $91,794 |
| Immigrants | Serbia | 98.6 /100 | #97 | Exceptional $91,730 |
| Immigrants | Southern Europe | 98.5 /100 | #98 | Exceptional $91,605 |
| Immigrants | South Eastern Asia | 98.4 /100 | #99 | Exceptional $91,541 |
| Ukrainians | 98.3 /100 | #100 | Exceptional $91,456 |
| Immigrants | Moldova | 98.3 /100 | #101 | Exceptional $91,446 |
| Austrians | 98.2 /100 | #102 | Exceptional $91,339 |
| Immigrants | Ukraine | 98.0 /100 | #103 | Exceptional $91,124 |
| Immigrants | Kazakhstan | 97.8 /100 | #104 | Exceptional $91,015 |
| Immigrants | Brazil | 97.7 /100 | #105 | Exceptional $90,907 |
| Macedonians | 97.4 /100 | #106 | Exceptional $90,761 |
| Croatians | 97.3 /100 | #107 | Exceptional $90,685 |
| Zimbabweans | 97.2 /100 | #108 | Exceptional $90,618 |
Demographics Similar to Danes by Median Household Income
In terms of median household income, the demographic groups most similar to Danes are Canadian ($87,769, a difference of 0.11%), Serbian ($87,572, a difference of 0.12%), Ugandan ($87,557, a difference of 0.14%), Immigrants from Uganda ($87,553, a difference of 0.14%), and South American Indian ($87,446, a difference of 0.26%).
| Demographics | Rating | Rank | Median Household Income |
| Poles | 89.7 /100 | #136 | Excellent $88,472 |
| Sierra Leoneans | 89.6 /100 | #137 | Excellent $88,463 |
| Arabs | 89.2 /100 | #138 | Excellent $88,398 |
| Immigrants | Chile | 89.2 /100 | #139 | Excellent $88,388 |
| Lebanese | 87.2 /100 | #140 | Excellent $88,091 |
| Immigrants | Morocco | 86.0 /100 | #141 | Excellent $87,930 |
| Canadians | 84.7 /100 | #142 | Excellent $87,769 |
| Danes | 83.9 /100 | #143 | Excellent $87,676 |
| Serbians | 83.0 /100 | #144 | Excellent $87,572 |
| Ugandans | 82.9 /100 | #145 | Excellent $87,557 |
| Immigrants | Uganda | 82.8 /100 | #146 | Excellent $87,553 |
| South American Indians | 81.8 /100 | #147 | Excellent $87,446 |
| Costa Ricans | 80.0 /100 | #148 | Excellent $87,262 |
| Immigrants | Nepal | 77.7 /100 | #149 | Good $87,046 |
| Basques | 77.2 /100 | #150 | Good $87,001 |