Immigrants from Western Asia vs Danish Median Household Income
COMPARE
Immigrants from Western Asia
Danish
Median Household Income
Median Household Income Comparison
Immigrants from Western Asia
Danes
$90,005
MEDIAN HOUSEHOLD INCOME
95.9/ 100
METRIC RATING
115th/ 347
METRIC RANK
$87,676
MEDIAN HOUSEHOLD INCOME
83.9/ 100
METRIC RATING
143rd/ 347
METRIC RANK
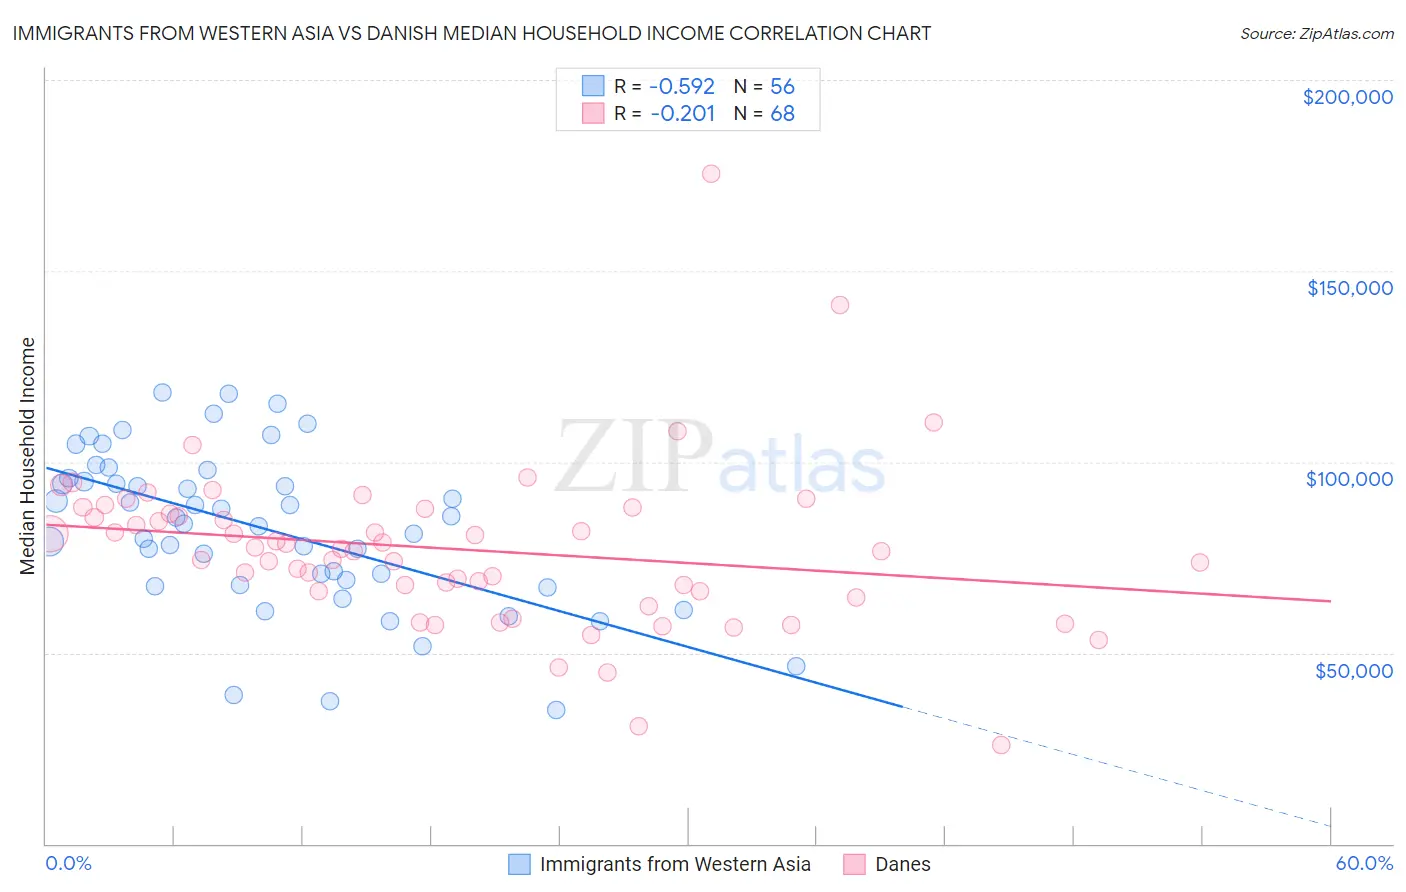
Immigrants from Western Asia vs Danish Median Household Income Correlation Chart
The statistical analysis conducted on geographies consisting of 404,096,096 people shows a substantial negative correlation between the proportion of Immigrants from Western Asia and median household income in the United States with a correlation coefficient (R) of -0.592 and weighted average of $90,005. Similarly, the statistical analysis conducted on geographies consisting of 473,742,440 people shows a weak negative correlation between the proportion of Danes and median household income in the United States with a correlation coefficient (R) of -0.201 and weighted average of $87,676, a difference of 2.7%.
Median Household Income Correlation Summary
| Measurement | Immigrants from Western Asia | Danish |
| Minimum | $35,078 | $25,809 |
| Maximum | $118,185 | $175,595 |
| Range | $83,107 | $149,786 |
| Mean | $82,428 | $77,182 |
| Median | $84,634 | $76,890 |
| Interquartile 25% (IQ1) | $68,360 | $66,124 |
| Interquartile 75% (IQ3) | $95,239 | $87,030 |
| Interquartile Range (IQR) | $26,880 | $20,907 |
| Standard Deviation (Sample) | $20,407 | $21,727 |
| Standard Deviation (Population) | $20,224 | $21,566 |
Similar Demographics by Median Household Income
Demographics Similar to Immigrants from Western Asia by Median Household Income
In terms of median household income, the demographic groups most similar to Immigrants from Western Asia are Immigrants from Northern Africa ($90,026, a difference of 0.020%), Native Hawaiian ($89,919, a difference of 0.10%), Taiwanese ($89,900, a difference of 0.12%), Syrian ($89,830, a difference of 0.19%), and Peruvian ($90,261, a difference of 0.28%).
| Demographics | Rating | Rank | Median Household Income |
| Zimbabweans | 97.2 /100 | #108 | Exceptional $90,618 |
| Chileans | 97.2 /100 | #109 | Exceptional $90,605 |
| Palestinians | 97.1 /100 | #110 | Exceptional $90,574 |
| Immigrants | Poland | 97.1 /100 | #111 | Exceptional $90,549 |
| Northern Europeans | 96.9 /100 | #112 | Exceptional $90,446 |
| Peruvians | 96.5 /100 | #113 | Exceptional $90,261 |
| Immigrants | Northern Africa | 95.9 /100 | #114 | Exceptional $90,026 |
| Immigrants | Western Asia | 95.9 /100 | #115 | Exceptional $90,005 |
| Native Hawaiians | 95.7 /100 | #116 | Exceptional $89,919 |
| Taiwanese | 95.6 /100 | #117 | Exceptional $89,900 |
| Syrians | 95.4 /100 | #118 | Exceptional $89,830 |
| Albanians | 95.2 /100 | #119 | Exceptional $89,744 |
| Immigrants | North Macedonia | 95.2 /100 | #120 | Exceptional $89,741 |
| Ethiopians | 94.9 /100 | #121 | Exceptional $89,640 |
| Pakistanis | 94.8 /100 | #122 | Exceptional $89,638 |
Demographics Similar to Danes by Median Household Income
In terms of median household income, the demographic groups most similar to Danes are Canadian ($87,769, a difference of 0.11%), Serbian ($87,572, a difference of 0.12%), Ugandan ($87,557, a difference of 0.14%), Immigrants from Uganda ($87,553, a difference of 0.14%), and South American Indian ($87,446, a difference of 0.26%).
| Demographics | Rating | Rank | Median Household Income |
| Poles | 89.7 /100 | #136 | Excellent $88,472 |
| Sierra Leoneans | 89.6 /100 | #137 | Excellent $88,463 |
| Arabs | 89.2 /100 | #138 | Excellent $88,398 |
| Immigrants | Chile | 89.2 /100 | #139 | Excellent $88,388 |
| Lebanese | 87.2 /100 | #140 | Excellent $88,091 |
| Immigrants | Morocco | 86.0 /100 | #141 | Excellent $87,930 |
| Canadians | 84.7 /100 | #142 | Excellent $87,769 |
| Danes | 83.9 /100 | #143 | Excellent $87,676 |
| Serbians | 83.0 /100 | #144 | Excellent $87,572 |
| Ugandans | 82.9 /100 | #145 | Excellent $87,557 |
| Immigrants | Uganda | 82.8 /100 | #146 | Excellent $87,553 |
| South American Indians | 81.8 /100 | #147 | Excellent $87,446 |
| Costa Ricans | 80.0 /100 | #148 | Excellent $87,262 |
| Immigrants | Nepal | 77.7 /100 | #149 | Good $87,046 |
| Basques | 77.2 /100 | #150 | Good $87,001 |