French Canadian vs South American Indian Per Capita Income
COMPARE
French Canadian
South American Indian
Per Capita Income
Per Capita Income Comparison
French Canadians
South American Indians
$43,003
PER CAPITA INCOME
32.3/ 100
METRIC RATING
186th/ 347
METRIC RANK
$44,206
PER CAPITA INCOME
64.8/ 100
METRIC RATING
157th/ 347
METRIC RANK
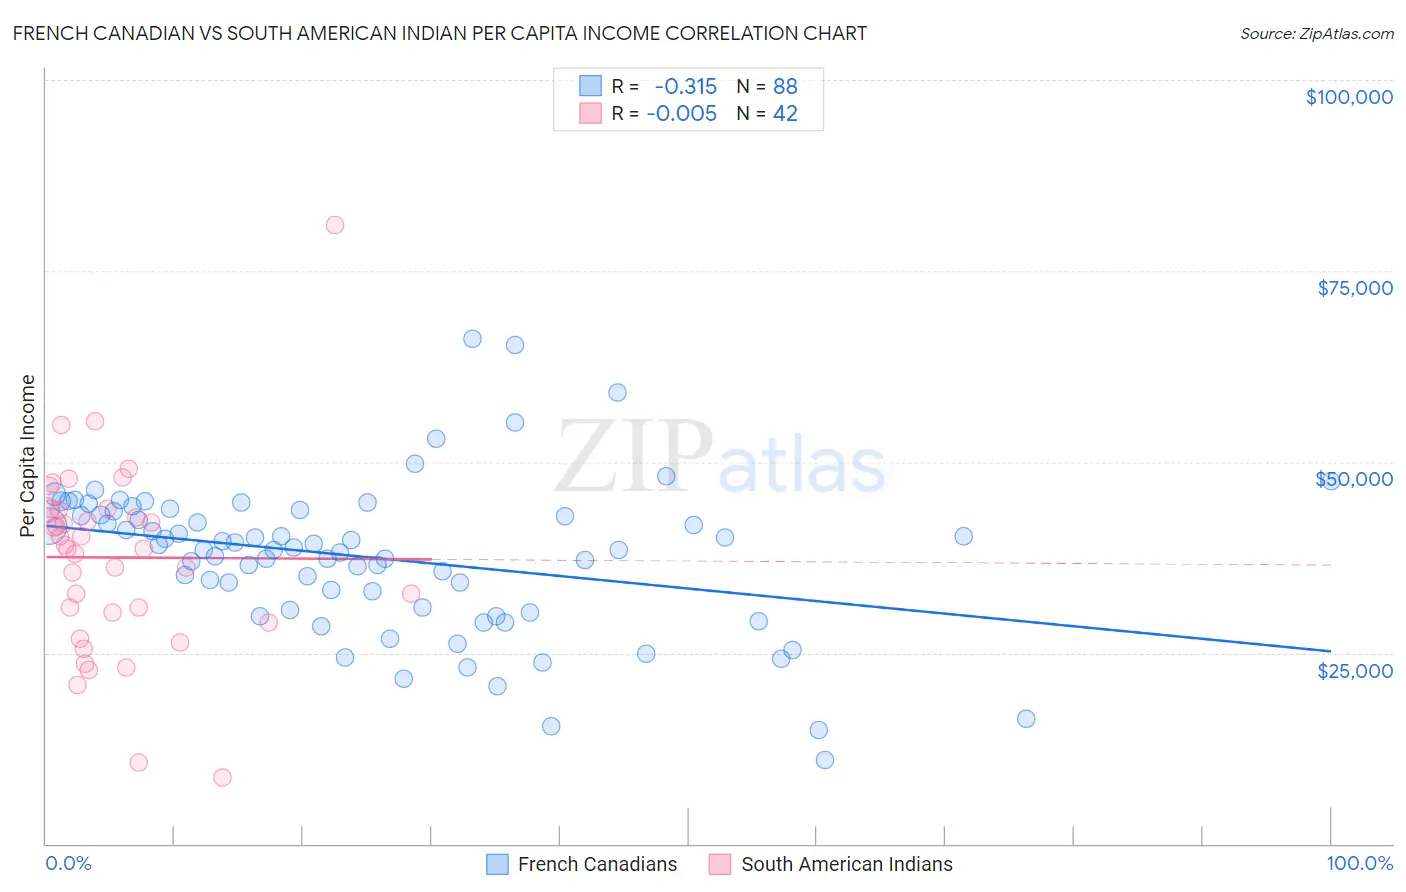
French Canadian vs South American Indian Per Capita Income Correlation Chart
The statistical analysis conducted on geographies consisting of 502,704,545 people shows a mild negative correlation between the proportion of French Canadians and per capita income in the United States with a correlation coefficient (R) of -0.315 and weighted average of $43,003. Similarly, the statistical analysis conducted on geographies consisting of 164,572,672 people shows no correlation between the proportion of South American Indians and per capita income in the United States with a correlation coefficient (R) of -0.005 and weighted average of $44,206, a difference of 2.8%.
Per Capita Income Correlation Summary
| Measurement | French Canadian | South American Indian |
| Minimum | $10,964 | $8,682 |
| Maximum | $66,177 | $81,082 |
| Range | $55,213 | $72,400 |
| Mean | $37,443 | $37,494 |
| Median | $38,631 | $38,904 |
| Interquartile 25% (IQ1) | $30,758 | $30,264 |
| Interquartile 75% (IQ3) | $43,262 | $43,746 |
| Interquartile Range (IQR) | $12,504 | $13,482 |
| Standard Deviation (Sample) | $9,955 | $12,540 |
| Standard Deviation (Population) | $9,898 | $12,390 |
Similar Demographics by Per Capita Income
Demographics Similar to French Canadians by Per Capita Income
In terms of per capita income, the demographic groups most similar to French Canadians are Immigrants ($43,010, a difference of 0.020%), Spaniard ($43,028, a difference of 0.060%), Immigrants from Colombia ($42,971, a difference of 0.070%), Immigrants from Africa ($42,950, a difference of 0.12%), and German ($43,067, a difference of 0.15%).
| Demographics | Rating | Rank | Per Capita Income |
| Finns | 44.4 /100 | #179 | Average $43,461 |
| Sierra Leoneans | 42.9 /100 | #180 | Average $43,405 |
| Welsh | 38.2 /100 | #181 | Fair $43,233 |
| Immigrants | Vietnam | 38.1 /100 | #182 | Fair $43,229 |
| Germans | 33.9 /100 | #183 | Fair $43,067 |
| Spaniards | 32.9 /100 | #184 | Fair $43,028 |
| Immigrants | Immigrants | 32.5 /100 | #185 | Fair $43,010 |
| French Canadians | 32.3 /100 | #186 | Fair $43,003 |
| Immigrants | Colombia | 31.5 /100 | #187 | Fair $42,971 |
| Immigrants | Africa | 31.0 /100 | #188 | Fair $42,950 |
| Bermudans | 30.1 /100 | #189 | Fair $42,911 |
| Kenyans | 27.7 /100 | #190 | Fair $42,808 |
| Yugoslavians | 27.4 /100 | #191 | Fair $42,792 |
| Iraqis | 26.7 /100 | #192 | Fair $42,760 |
| Immigrants | Sierra Leone | 26.5 /100 | #193 | Fair $42,752 |
Demographics Similar to South American Indians by Per Capita Income
In terms of per capita income, the demographic groups most similar to South American Indians are Immigrants from Nepal ($44,187, a difference of 0.040%), Slovak ($44,229, a difference of 0.050%), South American ($44,114, a difference of 0.21%), Uruguayan ($44,318, a difference of 0.25%), and Danish ($44,095, a difference of 0.25%).
| Demographics | Rating | Rank | Per Capita Income |
| Immigrants | Eritrea | 72.1 /100 | #150 | Good $44,509 |
| Norwegians | 71.5 /100 | #151 | Good $44,480 |
| Peruvians | 71.5 /100 | #152 | Good $44,479 |
| Scottish | 70.6 /100 | #153 | Good $44,440 |
| Portuguese | 68.7 /100 | #154 | Good $44,362 |
| Uruguayans | 67.6 /100 | #155 | Good $44,318 |
| Slovaks | 65.4 /100 | #156 | Good $44,229 |
| South American Indians | 64.8 /100 | #157 | Good $44,206 |
| Immigrants | Nepal | 64.3 /100 | #158 | Good $44,187 |
| South Americans | 62.4 /100 | #159 | Good $44,114 |
| Danes | 61.9 /100 | #160 | Good $44,095 |
| Costa Ricans | 61.8 /100 | #161 | Good $44,090 |
| Swiss | 61.4 /100 | #162 | Good $44,076 |
| Immigrants | South America | 61.2 /100 | #163 | Good $44,068 |
| Sri Lankans | 59.8 /100 | #164 | Average $44,014 |