Immigrants from Hungary vs South American Indian Per Capita Income
COMPARE
Immigrants from Hungary
South American Indian
Per Capita Income
Per Capita Income Comparison
Immigrants from Hungary
South American Indians
$49,303
PER CAPITA INCOME
99.8/ 100
METRIC RATING
72nd/ 347
METRIC RANK
$44,206
PER CAPITA INCOME
64.8/ 100
METRIC RATING
157th/ 347
METRIC RANK
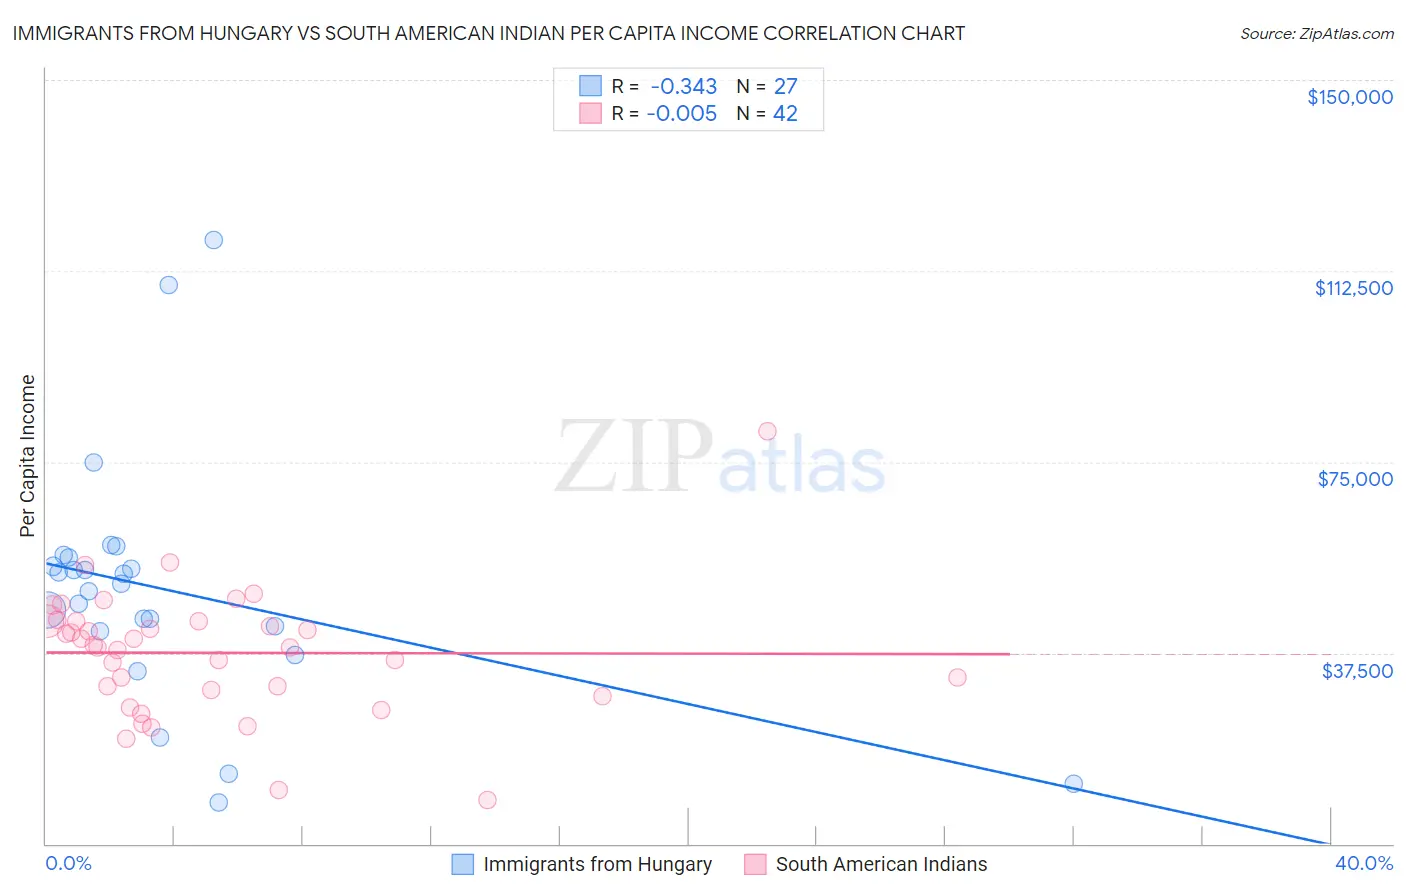
Immigrants from Hungary vs South American Indian Per Capita Income Correlation Chart
The statistical analysis conducted on geographies consisting of 195,712,632 people shows a mild negative correlation between the proportion of Immigrants from Hungary and per capita income in the United States with a correlation coefficient (R) of -0.343 and weighted average of $49,303. Similarly, the statistical analysis conducted on geographies consisting of 164,572,672 people shows no correlation between the proportion of South American Indians and per capita income in the United States with a correlation coefficient (R) of -0.005 and weighted average of $44,206, a difference of 11.5%.
Per Capita Income Correlation Summary
| Measurement | Immigrants from Hungary | South American Indian |
| Minimum | $8,083 | $8,682 |
| Maximum | $118,659 | $81,082 |
| Range | $110,576 | $72,400 |
| Mean | $49,900 | $37,494 |
| Median | $51,036 | $38,904 |
| Interquartile 25% (IQ1) | $41,686 | $30,264 |
| Interquartile 75% (IQ3) | $56,245 | $43,746 |
| Interquartile Range (IQR) | $14,559 | $13,482 |
| Standard Deviation (Sample) | $24,211 | $12,540 |
| Standard Deviation (Population) | $23,759 | $12,390 |
Similar Demographics by Per Capita Income
Demographics Similar to Immigrants from Hungary by Per Capita Income
In terms of per capita income, the demographic groups most similar to Immigrants from Hungary are Immigrants from North America ($49,302, a difference of 0.0%), Greek ($49,309, a difference of 0.010%), Immigrants from Eastern Europe ($49,316, a difference of 0.030%), Immigrants from Canada ($49,412, a difference of 0.22%), and Mongolian ($49,173, a difference of 0.26%).
| Demographics | Rating | Rank | Per Capita Income |
| Bolivians | 99.9 /100 | #65 | Exceptional $49,526 |
| Immigrants | Bulgaria | 99.9 /100 | #66 | Exceptional $49,482 |
| Immigrants | Romania | 99.9 /100 | #67 | Exceptional $49,463 |
| Lithuanians | 99.8 /100 | #68 | Exceptional $49,448 |
| Immigrants | Canada | 99.8 /100 | #69 | Exceptional $49,412 |
| Immigrants | Eastern Europe | 99.8 /100 | #70 | Exceptional $49,316 |
| Greeks | 99.8 /100 | #71 | Exceptional $49,309 |
| Immigrants | Hungary | 99.8 /100 | #72 | Exceptional $49,303 |
| Immigrants | North America | 99.8 /100 | #73 | Exceptional $49,302 |
| Mongolians | 99.8 /100 | #74 | Exceptional $49,173 |
| Immigrants | Bolivia | 99.7 /100 | #75 | Exceptional $48,970 |
| Immigrants | England | 99.7 /100 | #76 | Exceptional $48,844 |
| Immigrants | Kazakhstan | 99.7 /100 | #77 | Exceptional $48,747 |
| Immigrants | Italy | 99.6 /100 | #78 | Exceptional $48,654 |
| Romanians | 99.5 /100 | #79 | Exceptional $48,445 |
Demographics Similar to South American Indians by Per Capita Income
In terms of per capita income, the demographic groups most similar to South American Indians are Immigrants from Nepal ($44,187, a difference of 0.040%), Slovak ($44,229, a difference of 0.050%), South American ($44,114, a difference of 0.21%), Uruguayan ($44,318, a difference of 0.25%), and Danish ($44,095, a difference of 0.25%).
| Demographics | Rating | Rank | Per Capita Income |
| Immigrants | Eritrea | 72.1 /100 | #150 | Good $44,509 |
| Norwegians | 71.5 /100 | #151 | Good $44,480 |
| Peruvians | 71.5 /100 | #152 | Good $44,479 |
| Scottish | 70.6 /100 | #153 | Good $44,440 |
| Portuguese | 68.7 /100 | #154 | Good $44,362 |
| Uruguayans | 67.6 /100 | #155 | Good $44,318 |
| Slovaks | 65.4 /100 | #156 | Good $44,229 |
| South American Indians | 64.8 /100 | #157 | Good $44,206 |
| Immigrants | Nepal | 64.3 /100 | #158 | Good $44,187 |
| South Americans | 62.4 /100 | #159 | Good $44,114 |
| Danes | 61.9 /100 | #160 | Good $44,095 |
| Costa Ricans | 61.8 /100 | #161 | Good $44,090 |
| Swiss | 61.4 /100 | #162 | Good $44,076 |
| Immigrants | South America | 61.2 /100 | #163 | Good $44,068 |
| Sri Lankans | 59.8 /100 | #164 | Average $44,014 |