Chickasaw vs Cherokee Median Male Earnings
COMPARE
Chickasaw
Cherokee
Median Male Earnings
Median Male Earnings Comparison
Chickasaw
Cherokee
$47,832
MEDIAN MALE EARNINGS
0.1/ 100
METRIC RATING
289th/ 347
METRIC RANK
$48,669
MEDIAN MALE EARNINGS
0.3/ 100
METRIC RATING
271st/ 347
METRIC RANK
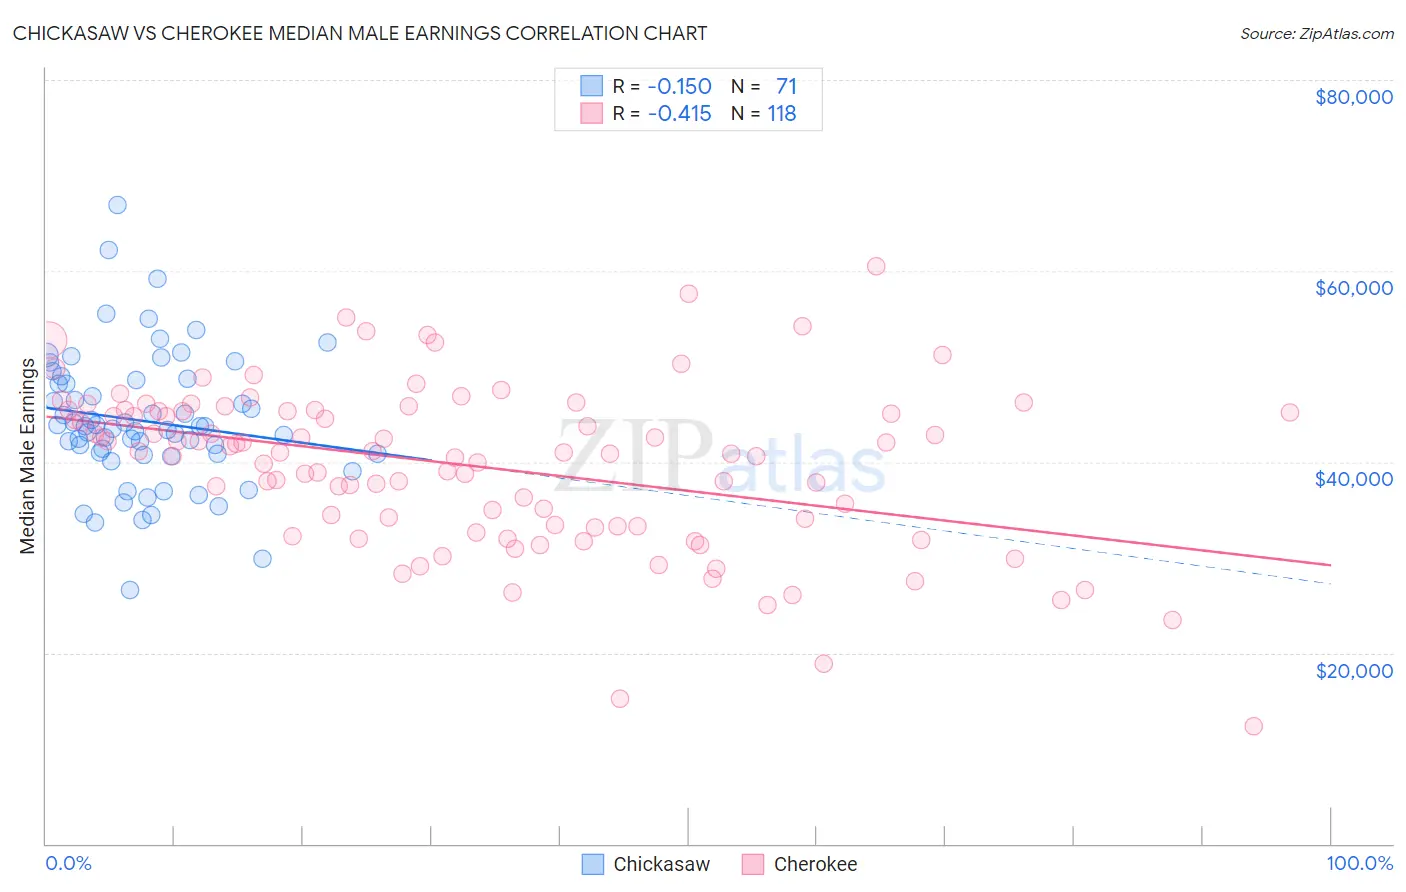
Chickasaw vs Cherokee Median Male Earnings Correlation Chart
The statistical analysis conducted on geographies consisting of 147,698,566 people shows a poor negative correlation between the proportion of Chickasaw and median male earnings in the United States with a correlation coefficient (R) of -0.150 and weighted average of $47,832. Similarly, the statistical analysis conducted on geographies consisting of 493,193,856 people shows a moderate negative correlation between the proportion of Cherokee and median male earnings in the United States with a correlation coefficient (R) of -0.415 and weighted average of $48,669, a difference of 1.8%.
Median Male Earnings Correlation Summary
| Measurement | Chickasaw | Cherokee |
| Minimum | $26,528 | $12,361 |
| Maximum | $66,918 | $60,438 |
| Range | $40,390 | $48,077 |
| Mean | $44,260 | $39,586 |
| Median | $43,730 | $40,957 |
| Interquartile 25% (IQ1) | $40,813 | $33,308 |
| Interquartile 75% (IQ3) | $48,579 | $45,365 |
| Interquartile Range (IQR) | $7,766 | $12,057 |
| Standard Deviation (Sample) | $7,030 | $8,544 |
| Standard Deviation (Population) | $6,980 | $8,508 |
Demographics Similar to Chickasaw and Cherokee by Median Male Earnings
In terms of median male earnings, the demographic groups most similar to Chickasaw are Immigrants from Belize ($47,809, a difference of 0.050%), Shoshone ($47,930, a difference of 0.21%), Immigrants from El Salvador ($47,973, a difference of 0.30%), Paiute ($47,991, a difference of 0.33%), and Mexican American Indian ($47,990, a difference of 0.33%). Similarly, the demographic groups most similar to Cherokee are Salvadoran ($48,646, a difference of 0.050%), Jamaican ($48,632, a difference of 0.080%), Potawatomi ($48,768, a difference of 0.20%), Colville ($48,516, a difference of 0.32%), and Immigrants from Somalia ($48,439, a difference of 0.48%).
| Demographics | Rating | Rank | Median Male Earnings |
| Potawatomi | 0.4 /100 | #270 | Tragic $48,768 |
| Cherokee | 0.3 /100 | #271 | Tragic $48,669 |
| Salvadorans | 0.3 /100 | #272 | Tragic $48,646 |
| Jamaicans | 0.3 /100 | #273 | Tragic $48,632 |
| Colville | 0.3 /100 | #274 | Tragic $48,516 |
| Immigrants | Somalia | 0.3 /100 | #275 | Tragic $48,439 |
| Blackfeet | 0.3 /100 | #276 | Tragic $48,402 |
| Belizeans | 0.2 /100 | #277 | Tragic $48,358 |
| Immigrants | Liberia | 0.2 /100 | #278 | Tragic $48,317 |
| Hmong | 0.2 /100 | #279 | Tragic $48,254 |
| Comanche | 0.2 /100 | #280 | Tragic $48,202 |
| Marshallese | 0.2 /100 | #281 | Tragic $48,137 |
| Central Americans | 0.2 /100 | #282 | Tragic $48,093 |
| Immigrants | Jamaica | 0.2 /100 | #283 | Tragic $48,040 |
| Africans | 0.2 /100 | #284 | Tragic $47,994 |
| Paiute | 0.2 /100 | #285 | Tragic $47,991 |
| Mexican American Indians | 0.2 /100 | #286 | Tragic $47,990 |
| Immigrants | El Salvador | 0.2 /100 | #287 | Tragic $47,973 |
| Shoshone | 0.2 /100 | #288 | Tragic $47,930 |
| Chickasaw | 0.1 /100 | #289 | Tragic $47,832 |
| Immigrants | Belize | 0.1 /100 | #290 | Tragic $47,809 |