Chickasaw vs Immigrants from El Salvador Median Male Earnings
COMPARE
Chickasaw
Immigrants from El Salvador
Median Male Earnings
Median Male Earnings Comparison
Chickasaw
Immigrants from El Salvador
$47,832
MEDIAN MALE EARNINGS
0.1/ 100
METRIC RATING
289th/ 347
METRIC RANK
$47,973
MEDIAN MALE EARNINGS
0.2/ 100
METRIC RATING
287th/ 347
METRIC RANK
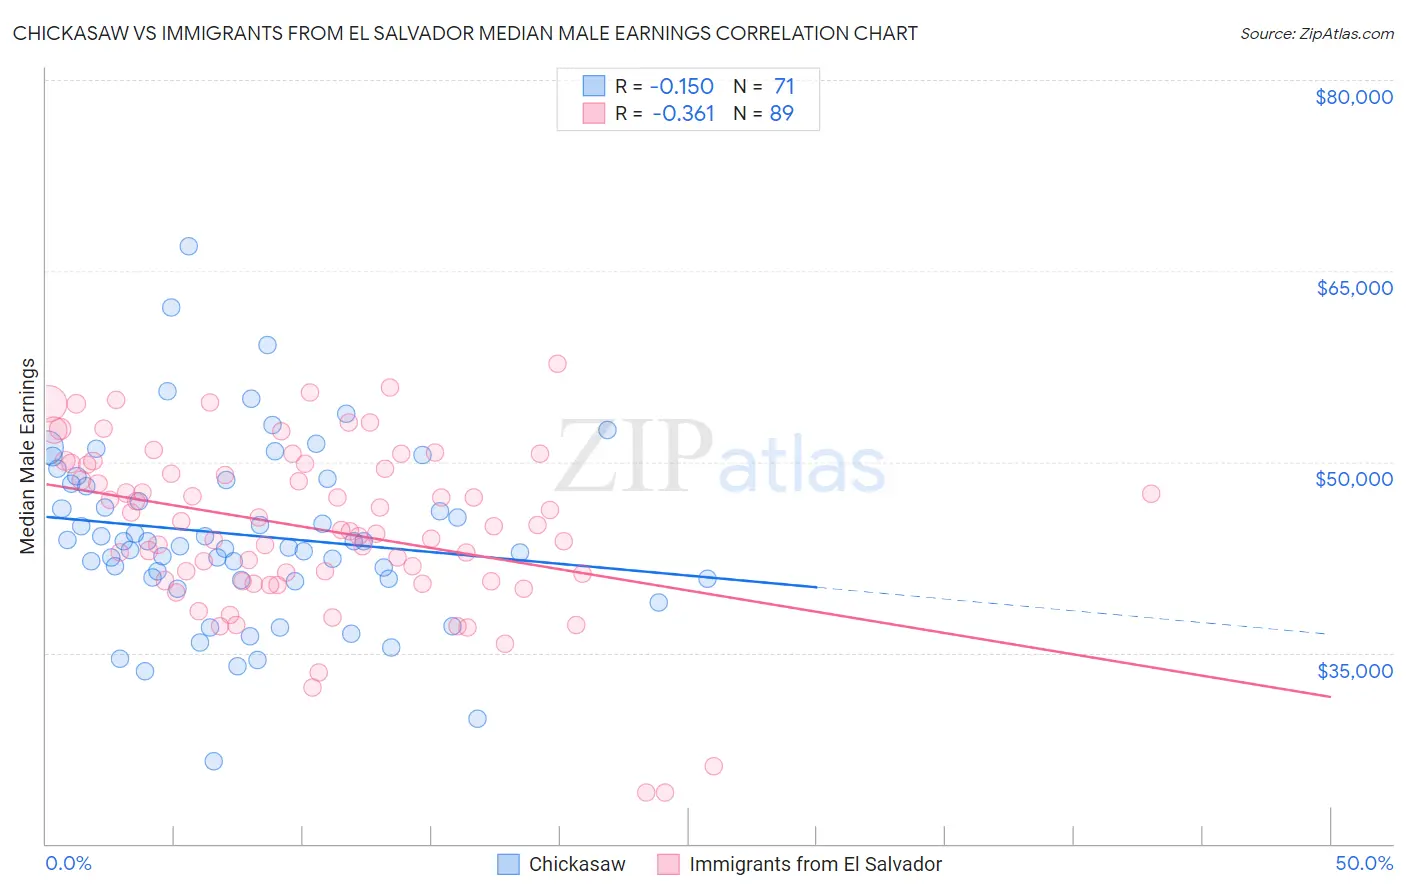
Chickasaw vs Immigrants from El Salvador Median Male Earnings Correlation Chart
The statistical analysis conducted on geographies consisting of 147,698,566 people shows a poor negative correlation between the proportion of Chickasaw and median male earnings in the United States with a correlation coefficient (R) of -0.150 and weighted average of $47,832. Similarly, the statistical analysis conducted on geographies consisting of 357,755,814 people shows a mild negative correlation between the proportion of Immigrants from El Salvador and median male earnings in the United States with a correlation coefficient (R) of -0.361 and weighted average of $47,973, a difference of 0.30%.
Median Male Earnings Correlation Summary
| Measurement | Chickasaw | Immigrants from El Salvador |
| Minimum | $26,528 | $24,025 |
| Maximum | $66,918 | $57,715 |
| Range | $40,390 | $33,690 |
| Mean | $44,260 | $44,787 |
| Median | $43,730 | $44,909 |
| Interquartile 25% (IQ1) | $40,813 | $40,644 |
| Interquartile 75% (IQ3) | $48,579 | $49,826 |
| Interquartile Range (IQR) | $7,766 | $9,182 |
| Standard Deviation (Sample) | $7,030 | $6,677 |
| Standard Deviation (Population) | $6,980 | $6,639 |
Demographics Similar to Chickasaw and Immigrants from El Salvador by Median Male Earnings
In terms of median male earnings, the demographic groups most similar to Chickasaw are Immigrants from Belize ($47,809, a difference of 0.050%), Shoshone ($47,930, a difference of 0.21%), Choctaw ($47,729, a difference of 0.22%), Paiute ($47,991, a difference of 0.33%), and Mexican American Indian ($47,990, a difference of 0.33%). Similarly, the demographic groups most similar to Immigrants from El Salvador are African ($47,994, a difference of 0.040%), Paiute ($47,991, a difference of 0.040%), Mexican American Indian ($47,990, a difference of 0.040%), Shoshone ($47,930, a difference of 0.090%), and Immigrants from Jamaica ($48,040, a difference of 0.14%).
| Demographics | Rating | Rank | Median Male Earnings |
| Immigrants | Liberia | 0.2 /100 | #278 | Tragic $48,317 |
| Hmong | 0.2 /100 | #279 | Tragic $48,254 |
| Comanche | 0.2 /100 | #280 | Tragic $48,202 |
| Marshallese | 0.2 /100 | #281 | Tragic $48,137 |
| Central Americans | 0.2 /100 | #282 | Tragic $48,093 |
| Immigrants | Jamaica | 0.2 /100 | #283 | Tragic $48,040 |
| Africans | 0.2 /100 | #284 | Tragic $47,994 |
| Paiute | 0.2 /100 | #285 | Tragic $47,991 |
| Mexican American Indians | 0.2 /100 | #286 | Tragic $47,990 |
| Immigrants | El Salvador | 0.2 /100 | #287 | Tragic $47,973 |
| Shoshone | 0.2 /100 | #288 | Tragic $47,930 |
| Chickasaw | 0.1 /100 | #289 | Tragic $47,832 |
| Immigrants | Belize | 0.1 /100 | #290 | Tragic $47,809 |
| Choctaw | 0.1 /100 | #291 | Tragic $47,729 |
| Immigrants | Dominica | 0.1 /100 | #292 | Tragic $47,651 |
| Indonesians | 0.1 /100 | #293 | Tragic $47,503 |
| Immigrants | Nicaragua | 0.1 /100 | #294 | Tragic $47,482 |
| Central American Indians | 0.1 /100 | #295 | Tragic $47,433 |
| Inupiat | 0.1 /100 | #296 | Tragic $47,281 |
| Dominicans | 0.1 /100 | #297 | Tragic $47,204 |
| Immigrants | Micronesia | 0.1 /100 | #298 | Tragic $47,177 |