Chickasaw vs Latvian Median Male Earnings
COMPARE
Chickasaw
Latvian
Median Male Earnings
Median Male Earnings Comparison
Chickasaw
Latvians
$47,832
MEDIAN MALE EARNINGS
0.1/ 100
METRIC RATING
289th/ 347
METRIC RANK
$63,498
MEDIAN MALE EARNINGS
100.0/ 100
METRIC RATING
31st/ 347
METRIC RANK
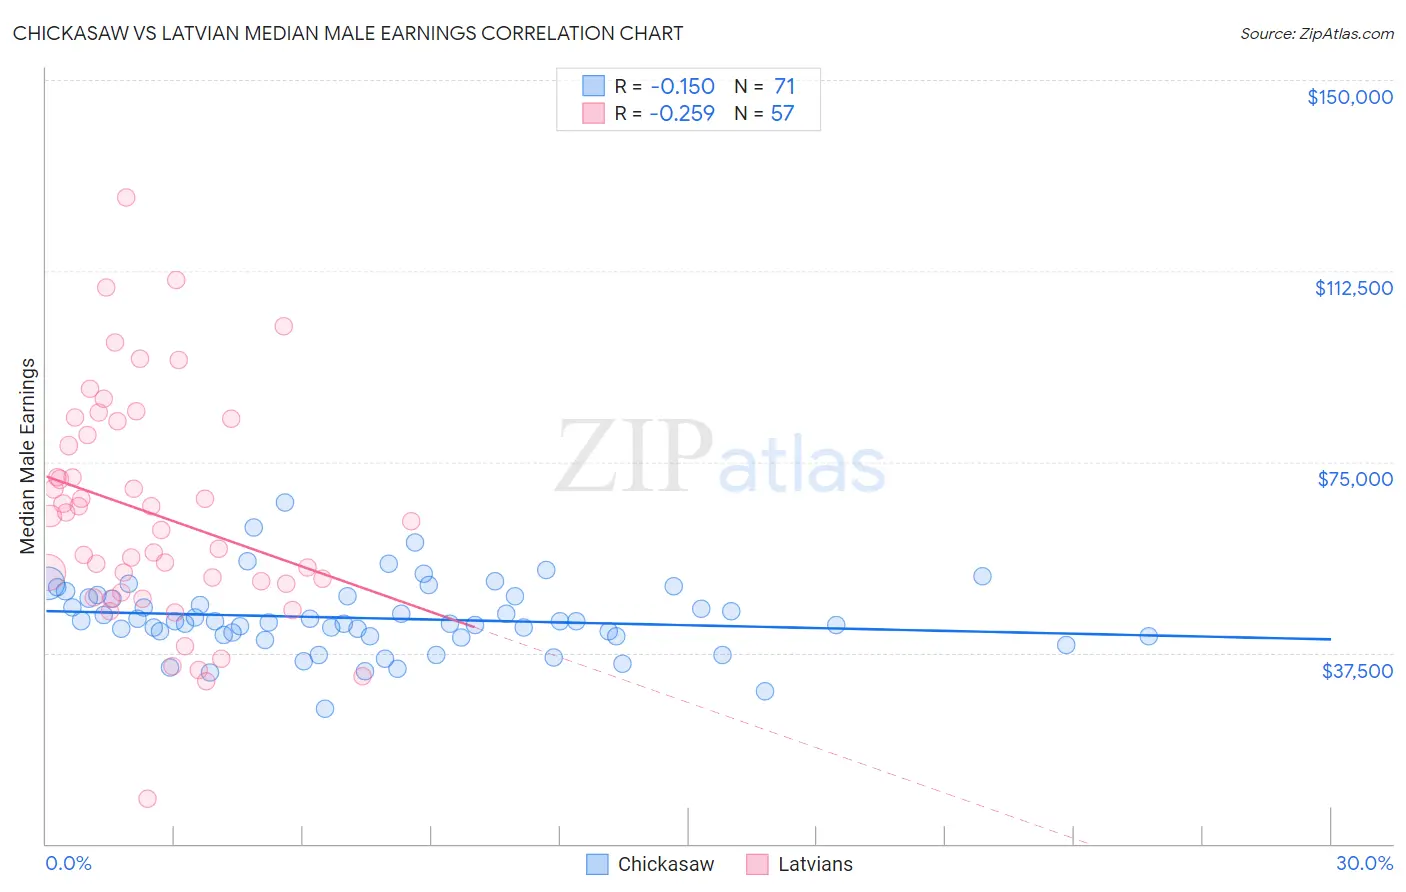
Chickasaw vs Latvian Median Male Earnings Correlation Chart
The statistical analysis conducted on geographies consisting of 147,698,566 people shows a poor negative correlation between the proportion of Chickasaw and median male earnings in the United States with a correlation coefficient (R) of -0.150 and weighted average of $47,832. Similarly, the statistical analysis conducted on geographies consisting of 220,682,058 people shows a weak negative correlation between the proportion of Latvians and median male earnings in the United States with a correlation coefficient (R) of -0.259 and weighted average of $63,498, a difference of 32.8%.
Median Male Earnings Correlation Summary
| Measurement | Chickasaw | Latvian |
| Minimum | $26,528 | $8,856 |
| Maximum | $66,918 | $126,871 |
| Range | $40,390 | $118,015 |
| Mean | $44,260 | $64,757 |
| Median | $43,730 | $63,438 |
| Interquartile 25% (IQ1) | $40,813 | $50,186 |
| Interquartile 75% (IQ3) | $48,579 | $81,584 |
| Interquartile Range (IQR) | $7,766 | $31,398 |
| Standard Deviation (Sample) | $7,030 | $22,394 |
| Standard Deviation (Population) | $6,980 | $22,197 |
Similar Demographics by Median Male Earnings
Demographics Similar to Chickasaw by Median Male Earnings
In terms of median male earnings, the demographic groups most similar to Chickasaw are Immigrants from Belize ($47,809, a difference of 0.050%), Shoshone ($47,930, a difference of 0.21%), Choctaw ($47,729, a difference of 0.22%), Immigrants from El Salvador ($47,973, a difference of 0.30%), and Paiute ($47,991, a difference of 0.33%).
| Demographics | Rating | Rank | Median Male Earnings |
| Central Americans | 0.2 /100 | #282 | Tragic $48,093 |
| Immigrants | Jamaica | 0.2 /100 | #283 | Tragic $48,040 |
| Africans | 0.2 /100 | #284 | Tragic $47,994 |
| Paiute | 0.2 /100 | #285 | Tragic $47,991 |
| Mexican American Indians | 0.2 /100 | #286 | Tragic $47,990 |
| Immigrants | El Salvador | 0.2 /100 | #287 | Tragic $47,973 |
| Shoshone | 0.2 /100 | #288 | Tragic $47,930 |
| Chickasaw | 0.1 /100 | #289 | Tragic $47,832 |
| Immigrants | Belize | 0.1 /100 | #290 | Tragic $47,809 |
| Choctaw | 0.1 /100 | #291 | Tragic $47,729 |
| Immigrants | Dominica | 0.1 /100 | #292 | Tragic $47,651 |
| Indonesians | 0.1 /100 | #293 | Tragic $47,503 |
| Immigrants | Nicaragua | 0.1 /100 | #294 | Tragic $47,482 |
| Central American Indians | 0.1 /100 | #295 | Tragic $47,433 |
| Inupiat | 0.1 /100 | #296 | Tragic $47,281 |
Demographics Similar to Latvians by Median Male Earnings
In terms of median male earnings, the demographic groups most similar to Latvians are Soviet Union ($63,382, a difference of 0.18%), Immigrants from Lithuania ($63,346, a difference of 0.24%), Immigrants from Russia ($63,326, a difference of 0.27%), Immigrants from France ($63,715, a difference of 0.34%), and Immigrants from Asia ($63,240, a difference of 0.41%).
| Demographics | Rating | Rank | Median Male Earnings |
| Immigrants | Northern Europe | 100.0 /100 | #24 | Exceptional $64,987 |
| Immigrants | Denmark | 100.0 /100 | #25 | Exceptional $64,625 |
| Turks | 100.0 /100 | #26 | Exceptional $64,253 |
| Immigrants | Switzerland | 100.0 /100 | #27 | Exceptional $63,944 |
| Russians | 100.0 /100 | #28 | Exceptional $63,939 |
| Asians | 100.0 /100 | #29 | Exceptional $63,827 |
| Immigrants | France | 100.0 /100 | #30 | Exceptional $63,715 |
| Latvians | 100.0 /100 | #31 | Exceptional $63,498 |
| Soviet Union | 100.0 /100 | #32 | Exceptional $63,382 |
| Immigrants | Lithuania | 100.0 /100 | #33 | Exceptional $63,346 |
| Immigrants | Russia | 100.0 /100 | #34 | Exceptional $63,326 |
| Immigrants | Asia | 100.0 /100 | #35 | Exceptional $63,240 |
| Israelis | 100.0 /100 | #36 | Exceptional $63,228 |
| Immigrants | Sri Lanka | 100.0 /100 | #37 | Exceptional $63,099 |
| Maltese | 100.0 /100 | #38 | Exceptional $62,953 |