Chickasaw vs Armenian Median Male Earnings
COMPARE
Chickasaw
Armenian
Median Male Earnings
Median Male Earnings Comparison
Chickasaw
Armenians
$47,832
MEDIAN MALE EARNINGS
0.1/ 100
METRIC RATING
289th/ 347
METRIC RANK
$58,134
MEDIAN MALE EARNINGS
97.3/ 100
METRIC RATING
104th/ 347
METRIC RANK
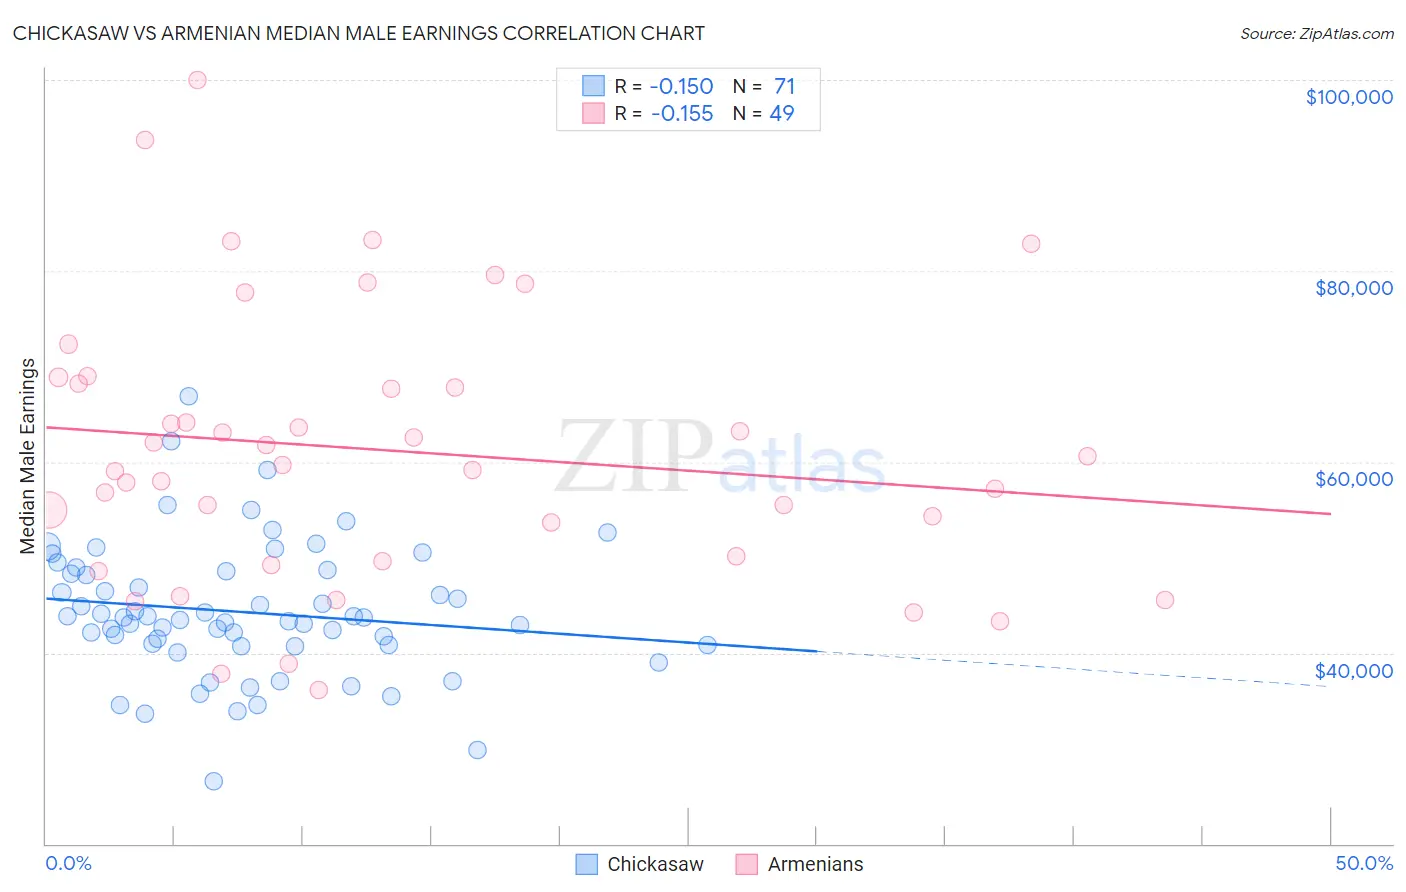
Chickasaw vs Armenian Median Male Earnings Correlation Chart
The statistical analysis conducted on geographies consisting of 147,698,566 people shows a poor negative correlation between the proportion of Chickasaw and median male earnings in the United States with a correlation coefficient (R) of -0.150 and weighted average of $47,832. Similarly, the statistical analysis conducted on geographies consisting of 310,896,747 people shows a poor negative correlation between the proportion of Armenians and median male earnings in the United States with a correlation coefficient (R) of -0.155 and weighted average of $58,134, a difference of 21.5%.
Median Male Earnings Correlation Summary
| Measurement | Chickasaw | Armenian |
| Minimum | $26,528 | $36,151 |
| Maximum | $66,918 | $99,997 |
| Range | $40,390 | $63,846 |
| Mean | $44,260 | $61,183 |
| Median | $43,730 | $59,670 |
| Interquartile 25% (IQ1) | $40,813 | $49,867 |
| Interquartile 75% (IQ3) | $48,579 | $68,550 |
| Interquartile Range (IQR) | $7,766 | $18,683 |
| Standard Deviation (Sample) | $7,030 | $14,235 |
| Standard Deviation (Population) | $6,980 | $14,089 |
Similar Demographics by Median Male Earnings
Demographics Similar to Chickasaw by Median Male Earnings
In terms of median male earnings, the demographic groups most similar to Chickasaw are Immigrants from Belize ($47,809, a difference of 0.050%), Shoshone ($47,930, a difference of 0.21%), Choctaw ($47,729, a difference of 0.22%), Immigrants from El Salvador ($47,973, a difference of 0.30%), and Paiute ($47,991, a difference of 0.33%).
| Demographics | Rating | Rank | Median Male Earnings |
| Central Americans | 0.2 /100 | #282 | Tragic $48,093 |
| Immigrants | Jamaica | 0.2 /100 | #283 | Tragic $48,040 |
| Africans | 0.2 /100 | #284 | Tragic $47,994 |
| Paiute | 0.2 /100 | #285 | Tragic $47,991 |
| Mexican American Indians | 0.2 /100 | #286 | Tragic $47,990 |
| Immigrants | El Salvador | 0.2 /100 | #287 | Tragic $47,973 |
| Shoshone | 0.2 /100 | #288 | Tragic $47,930 |
| Chickasaw | 0.1 /100 | #289 | Tragic $47,832 |
| Immigrants | Belize | 0.1 /100 | #290 | Tragic $47,809 |
| Choctaw | 0.1 /100 | #291 | Tragic $47,729 |
| Immigrants | Dominica | 0.1 /100 | #292 | Tragic $47,651 |
| Indonesians | 0.1 /100 | #293 | Tragic $47,503 |
| Immigrants | Nicaragua | 0.1 /100 | #294 | Tragic $47,482 |
| Central American Indians | 0.1 /100 | #295 | Tragic $47,433 |
| Inupiat | 0.1 /100 | #296 | Tragic $47,281 |
Demographics Similar to Armenians by Median Male Earnings
In terms of median male earnings, the demographic groups most similar to Armenians are Polish ($58,139, a difference of 0.010%), Immigrants from Western Asia ($58,131, a difference of 0.010%), Syrian ($58,187, a difference of 0.090%), Immigrants from Northern Africa ($58,008, a difference of 0.22%), and Serbian ($57,975, a difference of 0.27%).
| Demographics | Rating | Rank | Median Male Earnings |
| Northern Europeans | 98.2 /100 | #97 | Exceptional $58,588 |
| Jordanians | 98.1 /100 | #98 | Exceptional $58,500 |
| Immigrants | Poland | 98.0 /100 | #99 | Exceptional $58,452 |
| Assyrians/Chaldeans/Syriacs | 97.9 /100 | #100 | Exceptional $58,437 |
| Immigrants | Brazil | 97.7 /100 | #101 | Exceptional $58,324 |
| Syrians | 97.4 /100 | #102 | Exceptional $58,187 |
| Poles | 97.3 /100 | #103 | Exceptional $58,139 |
| Armenians | 97.3 /100 | #104 | Exceptional $58,134 |
| Immigrants | Western Asia | 97.3 /100 | #105 | Exceptional $58,131 |
| Immigrants | Northern Africa | 96.9 /100 | #106 | Exceptional $58,008 |
| Serbians | 96.8 /100 | #107 | Exceptional $57,975 |
| Immigrants | Uzbekistan | 96.7 /100 | #108 | Exceptional $57,941 |
| British | 96.5 /100 | #109 | Exceptional $57,890 |
| Palestinians | 96.2 /100 | #110 | Exceptional $57,778 |
| Europeans | 95.6 /100 | #111 | Exceptional $57,637 |