Cheyenne vs Paiute Median Earnings
COMPARE
Cheyenne
Paiute
Median Earnings
Median Earnings Comparison
Cheyenne
Paiute
$40,233
MEDIAN EARNINGS
0.0/ 100
METRIC RATING
314th/ 347
METRIC RANK
$41,508
MEDIAN EARNINGS
0.1/ 100
METRIC RATING
290th/ 347
METRIC RANK
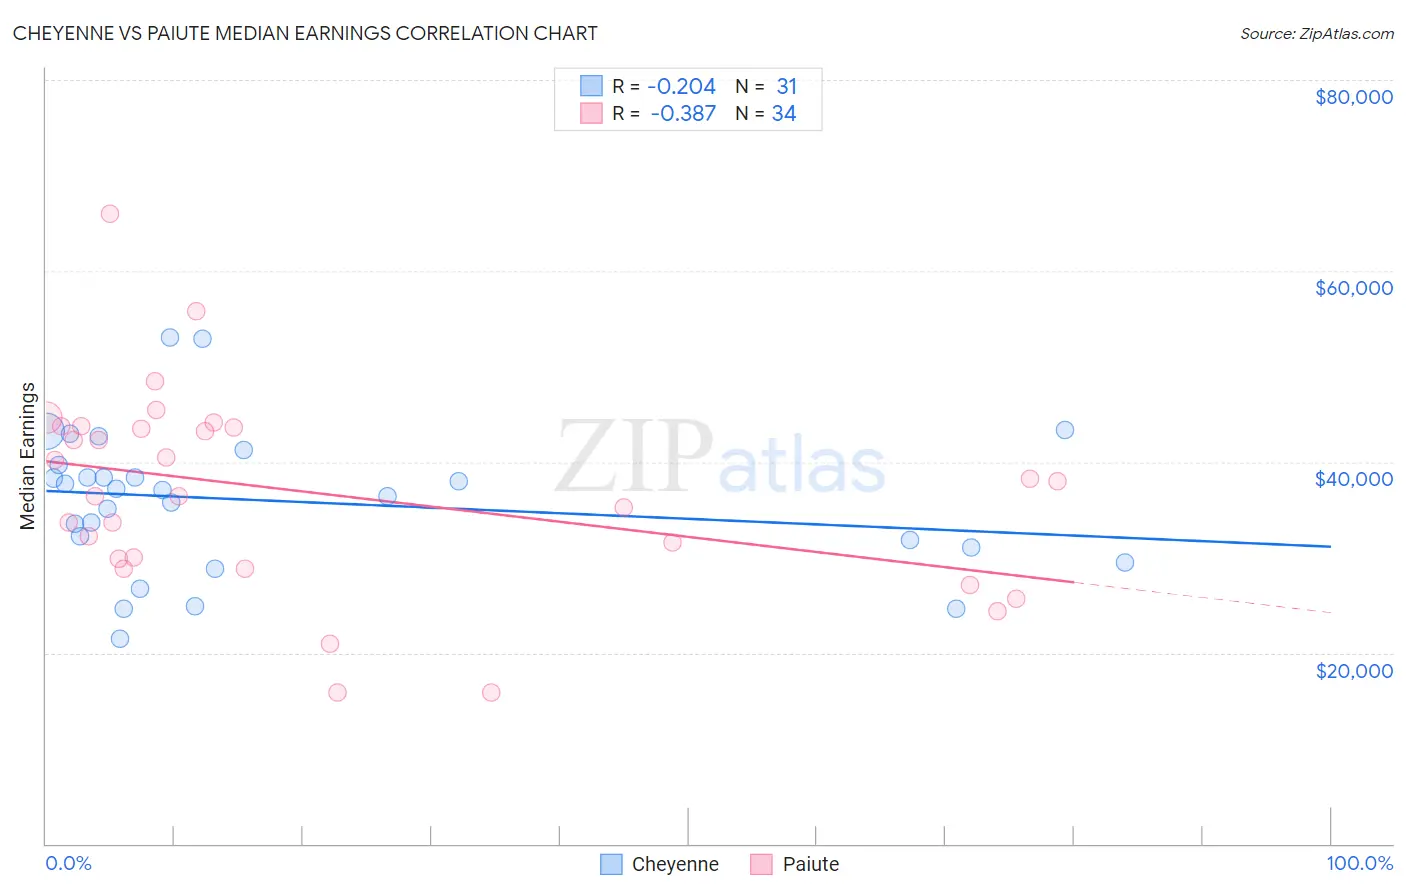
Cheyenne vs Paiute Median Earnings Correlation Chart
The statistical analysis conducted on geographies consisting of 80,717,230 people shows a weak negative correlation between the proportion of Cheyenne and median earnings in the United States with a correlation coefficient (R) of -0.204 and weighted average of $40,233. Similarly, the statistical analysis conducted on geographies consisting of 58,401,249 people shows a mild negative correlation between the proportion of Paiute and median earnings in the United States with a correlation coefficient (R) of -0.387 and weighted average of $41,508, a difference of 3.2%.
Median Earnings Correlation Summary
| Measurement | Cheyenne | Paiute |
| Minimum | $21,433 | $15,859 |
| Maximum | $52,964 | $65,957 |
| Range | $31,531 | $50,098 |
| Mean | $35,877 | $36,753 |
| Median | $37,115 | $37,218 |
| Interquartile 25% (IQ1) | $31,011 | $29,813 |
| Interquartile 75% (IQ3) | $39,717 | $43,606 |
| Interquartile Range (IQR) | $8,706 | $13,793 |
| Standard Deviation (Sample) | $7,496 | $10,514 |
| Standard Deviation (Population) | $7,374 | $10,358 |
Similar Demographics by Median Earnings
Demographics Similar to Cheyenne by Median Earnings
In terms of median earnings, the demographic groups most similar to Cheyenne are Seminole ($40,233, a difference of 0.0%), Choctaw ($40,270, a difference of 0.090%), Immigrants from Honduras ($40,195, a difference of 0.10%), Fijian ($40,193, a difference of 0.10%), and Chippewa ($40,287, a difference of 0.13%).
| Demographics | Rating | Rank | Median Earnings |
| Hondurans | 0.0 /100 | #307 | Tragic $40,638 |
| Cubans | 0.0 /100 | #308 | Tragic $40,619 |
| Immigrants | Haiti | 0.0 /100 | #309 | Tragic $40,550 |
| Apache | 0.0 /100 | #310 | Tragic $40,388 |
| Hispanics or Latinos | 0.0 /100 | #311 | Tragic $40,288 |
| Chippewa | 0.0 /100 | #312 | Tragic $40,287 |
| Choctaw | 0.0 /100 | #313 | Tragic $40,270 |
| Cheyenne | 0.0 /100 | #314 | Tragic $40,233 |
| Seminole | 0.0 /100 | #315 | Tragic $40,233 |
| Immigrants | Honduras | 0.0 /100 | #316 | Tragic $40,195 |
| Fijians | 0.0 /100 | #317 | Tragic $40,193 |
| Dutch West Indians | 0.0 /100 | #318 | Tragic $40,107 |
| Blacks/African Americans | 0.0 /100 | #319 | Tragic $40,085 |
| Immigrants | Bahamas | 0.0 /100 | #320 | Tragic $39,861 |
| Mexicans | 0.0 /100 | #321 | Tragic $39,834 |
Demographics Similar to Paiute by Median Earnings
In terms of median earnings, the demographic groups most similar to Paiute are Comanche ($41,519, a difference of 0.030%), Central American Indian ($41,474, a difference of 0.080%), Immigrants from Dominican Republic ($41,554, a difference of 0.11%), U.S. Virgin Islander ($41,448, a difference of 0.15%), and Immigrants from Zaire ($41,325, a difference of 0.44%).
| Demographics | Rating | Rank | Median Earnings |
| Dominicans | 0.2 /100 | #283 | Tragic $41,864 |
| Blackfeet | 0.2 /100 | #284 | Tragic $41,822 |
| Immigrants | Nicaragua | 0.1 /100 | #285 | Tragic $41,737 |
| Mexican American Indians | 0.1 /100 | #286 | Tragic $41,719 |
| Indonesians | 0.1 /100 | #287 | Tragic $41,701 |
| Immigrants | Dominican Republic | 0.1 /100 | #288 | Tragic $41,554 |
| Comanche | 0.1 /100 | #289 | Tragic $41,519 |
| Paiute | 0.1 /100 | #290 | Tragic $41,508 |
| Central American Indians | 0.1 /100 | #291 | Tragic $41,474 |
| U.S. Virgin Islanders | 0.1 /100 | #292 | Tragic $41,448 |
| Immigrants | Zaire | 0.1 /100 | #293 | Tragic $41,325 |
| Potawatomi | 0.1 /100 | #294 | Tragic $41,288 |
| Bangladeshis | 0.1 /100 | #295 | Tragic $41,263 |
| Cherokee | 0.1 /100 | #296 | Tragic $41,252 |
| Guatemalans | 0.1 /100 | #297 | Tragic $41,205 |