Israeli vs Pennsylvania German Median Household Income
COMPARE
Israeli
Pennsylvania German
Median Household Income
Median Household Income Comparison
Israelis
Pennsylvania Germans
$96,552
MEDIAN HOUSEHOLD INCOME
99.9/ 100
METRIC RATING
45th/ 347
METRIC RANK
$75,814
MEDIAN HOUSEHOLD INCOME
0.3/ 100
METRIC RATING
271st/ 347
METRIC RANK
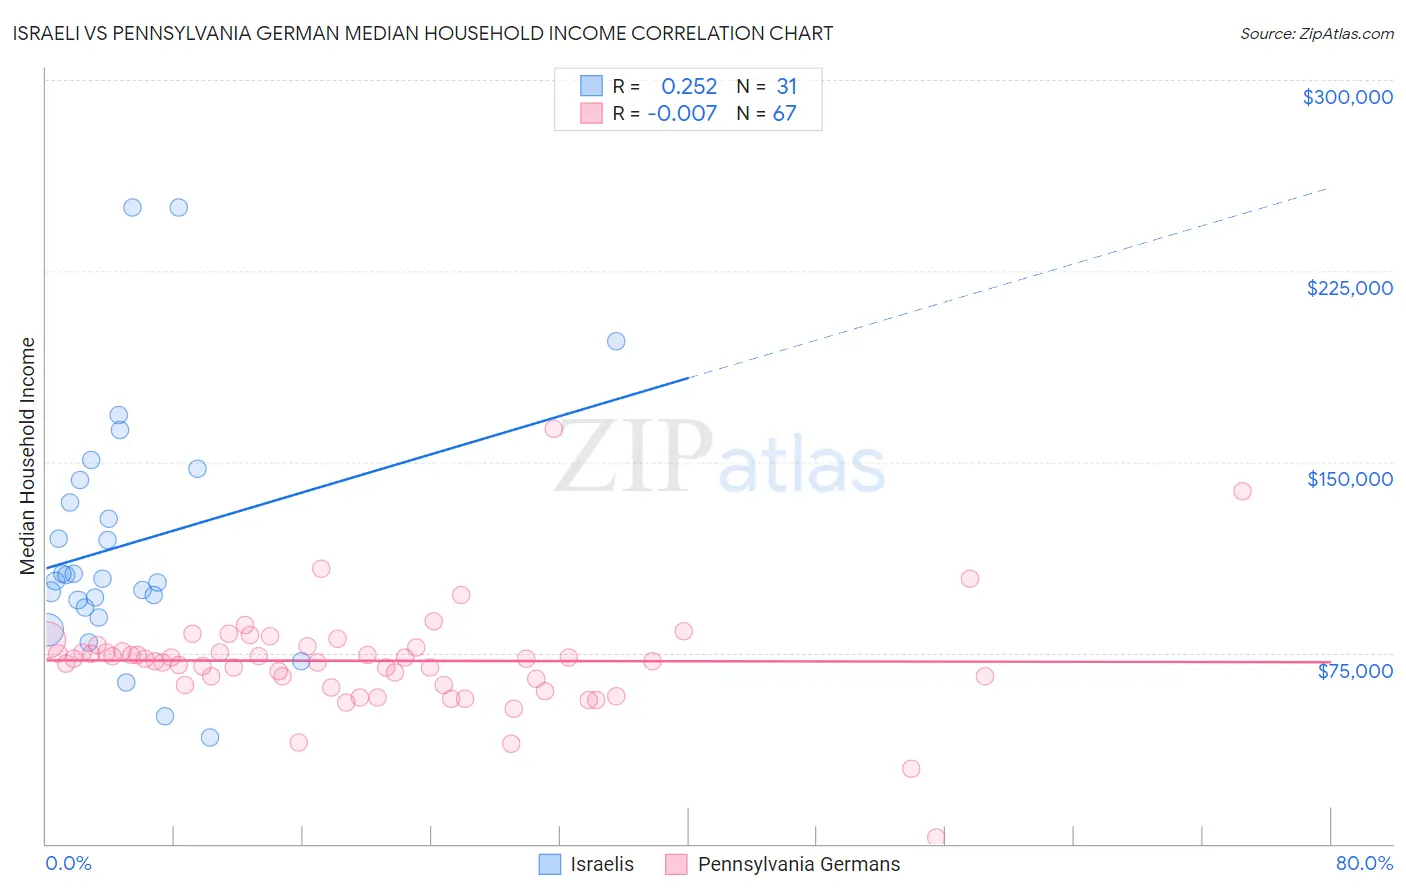
Israeli vs Pennsylvania German Median Household Income Correlation Chart
The statistical analysis conducted on geographies consisting of 210,971,551 people shows a weak positive correlation between the proportion of Israelis and median household income in the United States with a correlation coefficient (R) of 0.252 and weighted average of $96,552. Similarly, the statistical analysis conducted on geographies consisting of 234,029,688 people shows no correlation between the proportion of Pennsylvania Germans and median household income in the United States with a correlation coefficient (R) of -0.007 and weighted average of $75,814, a difference of 27.4%.
Median Household Income Correlation Summary
| Measurement | Israeli | Pennsylvania German |
| Minimum | $41,875 | $2,499 |
| Maximum | $250,001 | $162,917 |
| Range | $208,126 | $160,418 |
| Mean | $117,996 | $71,846 |
| Median | $104,190 | $72,559 |
| Interquartile 25% (IQ1) | $92,986 | $62,513 |
| Interquartile 75% (IQ3) | $142,824 | $76,865 |
| Interquartile Range (IQR) | $49,838 | $14,352 |
| Standard Deviation (Sample) | $48,790 | $20,812 |
| Standard Deviation (Population) | $47,997 | $20,656 |
Similar Demographics by Median Household Income
Demographics Similar to Israelis by Median Household Income
In terms of median household income, the demographic groups most similar to Israelis are Australian ($96,490, a difference of 0.060%), Immigrants from Greece ($96,675, a difference of 0.13%), Immigrants from Russia ($96,378, a difference of 0.18%), Immigrants from France ($96,743, a difference of 0.20%), and Cambodian ($96,324, a difference of 0.24%).
| Demographics | Rating | Rank | Median Household Income |
| Immigrants | Indonesia | 100.0 /100 | #38 | Exceptional $97,297 |
| Afghans | 100.0 /100 | #39 | Exceptional $97,026 |
| Maltese | 100.0 /100 | #40 | Exceptional $97,015 |
| Immigrants | Turkey | 100.0 /100 | #41 | Exceptional $96,964 |
| Immigrants | Lithuania | 99.9 /100 | #42 | Exceptional $96,836 |
| Immigrants | France | 99.9 /100 | #43 | Exceptional $96,743 |
| Immigrants | Greece | 99.9 /100 | #44 | Exceptional $96,675 |
| Israelis | 99.9 /100 | #45 | Exceptional $96,552 |
| Australians | 99.9 /100 | #46 | Exceptional $96,490 |
| Immigrants | Russia | 99.9 /100 | #47 | Exceptional $96,378 |
| Cambodians | 99.9 /100 | #48 | Exceptional $96,324 |
| Immigrants | Malaysia | 99.9 /100 | #49 | Exceptional $96,292 |
| Bulgarians | 99.9 /100 | #50 | Exceptional $96,290 |
| Estonians | 99.9 /100 | #51 | Exceptional $95,930 |
| Immigrants | South Africa | 99.9 /100 | #52 | Exceptional $95,800 |
Demographics Similar to Pennsylvania Germans by Median Household Income
In terms of median household income, the demographic groups most similar to Pennsylvania Germans are Hmong ($75,839, a difference of 0.030%), Somali ($75,782, a difference of 0.040%), Immigrants from Jamaica ($75,851, a difference of 0.050%), Cape Verdean ($75,848, a difference of 0.050%), and German Russian ($75,856, a difference of 0.060%).
| Demographics | Rating | Rank | Median Household Income |
| Guatemalans | 0.3 /100 | #264 | Tragic $75,961 |
| Immigrants | Belize | 0.3 /100 | #265 | Tragic $75,938 |
| Americans | 0.3 /100 | #266 | Tragic $75,932 |
| German Russians | 0.3 /100 | #267 | Tragic $75,856 |
| Immigrants | Jamaica | 0.3 /100 | #268 | Tragic $75,851 |
| Cape Verdeans | 0.3 /100 | #269 | Tragic $75,848 |
| Hmong | 0.3 /100 | #270 | Tragic $75,839 |
| Pennsylvania Germans | 0.3 /100 | #271 | Tragic $75,814 |
| Somalis | 0.3 /100 | #272 | Tragic $75,782 |
| Liberians | 0.2 /100 | #273 | Tragic $75,667 |
| British West Indians | 0.2 /100 | #274 | Tragic $75,647 |
| Immigrants | Micronesia | 0.2 /100 | #275 | Tragic $75,574 |
| Immigrants | Latin America | 0.2 /100 | #276 | Tragic $75,420 |
| Spanish Americans | 0.2 /100 | #277 | Tragic $75,386 |
| Osage | 0.2 /100 | #278 | Tragic $75,240 |