Immigrants from West Indies vs Pennsylvania German Median Household Income
COMPARE
Immigrants from West Indies
Pennsylvania German
Median Household Income
Median Household Income Comparison
Immigrants from West Indies
Pennsylvania Germans
$77,956
MEDIAN HOUSEHOLD INCOME
1.0/ 100
METRIC RATING
252nd/ 347
METRIC RANK
$75,814
MEDIAN HOUSEHOLD INCOME
0.3/ 100
METRIC RATING
271st/ 347
METRIC RANK
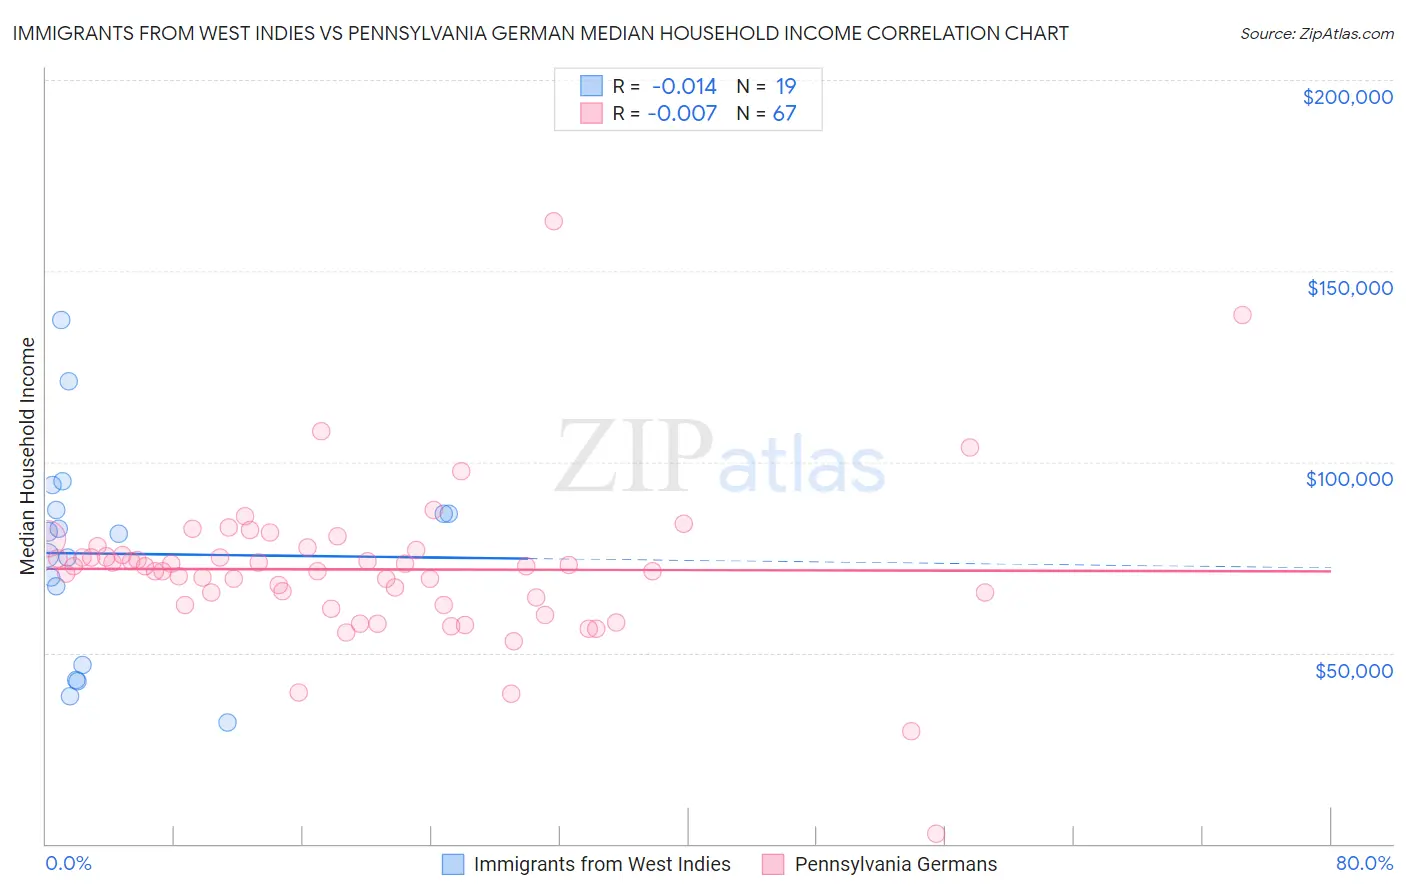
Immigrants from West Indies vs Pennsylvania German Median Household Income Correlation Chart
The statistical analysis conducted on geographies consisting of 72,454,628 people shows no correlation between the proportion of Immigrants from West Indies and median household income in the United States with a correlation coefficient (R) of -0.014 and weighted average of $77,956. Similarly, the statistical analysis conducted on geographies consisting of 234,029,688 people shows no correlation between the proportion of Pennsylvania Germans and median household income in the United States with a correlation coefficient (R) of -0.007 and weighted average of $75,814, a difference of 2.8%.
Median Household Income Correlation Summary
| Measurement | Immigrants from West Indies | Pennsylvania German |
| Minimum | $31,731 | $2,499 |
| Maximum | $137,182 | $162,917 |
| Range | $105,451 | $160,418 |
| Mean | $75,944 | $71,846 |
| Median | $81,103 | $72,559 |
| Interquartile 25% (IQ1) | $46,875 | $62,513 |
| Interquartile 75% (IQ3) | $87,404 | $76,865 |
| Interquartile Range (IQR) | $40,529 | $14,352 |
| Standard Deviation (Sample) | $27,297 | $20,812 |
| Standard Deviation (Population) | $26,569 | $20,656 |
Demographics Similar to Immigrants from West Indies and Pennsylvania Germans by Median Household Income
In terms of median household income, the demographic groups most similar to Immigrants from West Indies are Mexican American Indian ($78,166, a difference of 0.27%), Immigrants from St. Vincent and the Grenadines ($77,690, a difference of 0.34%), Subsaharan African ($77,631, a difference of 0.42%), Immigrants from Middle Africa ($77,559, a difference of 0.51%), and Belizean ($77,028, a difference of 1.2%). Similarly, the demographic groups most similar to Pennsylvania Germans are Hmong ($75,839, a difference of 0.030%), Immigrants from Jamaica ($75,851, a difference of 0.050%), Cape Verdean ($75,848, a difference of 0.050%), German Russian ($75,856, a difference of 0.060%), and Immigrants from Belize ($75,938, a difference of 0.16%).
| Demographics | Rating | Rank | Median Household Income |
| Mexican American Indians | 1.2 /100 | #251 | Tragic $78,166 |
| Immigrants | West Indies | 1.0 /100 | #252 | Tragic $77,956 |
| Immigrants | St. Vincent and the Grenadines | 0.9 /100 | #253 | Tragic $77,690 |
| Sub-Saharan Africans | 0.8 /100 | #254 | Tragic $77,631 |
| Immigrants | Middle Africa | 0.8 /100 | #255 | Tragic $77,559 |
| Belizeans | 0.6 /100 | #256 | Tragic $77,028 |
| Immigrants | Senegal | 0.5 /100 | #257 | Tragic $76,915 |
| Immigrants | Nicaragua | 0.5 /100 | #258 | Tragic $76,784 |
| Spanish American Indians | 0.4 /100 | #259 | Tragic $76,670 |
| Jamaicans | 0.4 /100 | #260 | Tragic $76,583 |
| Immigrants | Grenada | 0.4 /100 | #261 | Tragic $76,517 |
| French American Indians | 0.4 /100 | #262 | Tragic $76,387 |
| Alaskan Athabascans | 0.4 /100 | #263 | Tragic $76,383 |
| Guatemalans | 0.3 /100 | #264 | Tragic $75,961 |
| Immigrants | Belize | 0.3 /100 | #265 | Tragic $75,938 |
| Americans | 0.3 /100 | #266 | Tragic $75,932 |
| German Russians | 0.3 /100 | #267 | Tragic $75,856 |
| Immigrants | Jamaica | 0.3 /100 | #268 | Tragic $75,851 |
| Cape Verdeans | 0.3 /100 | #269 | Tragic $75,848 |
| Hmong | 0.3 /100 | #270 | Tragic $75,839 |
| Pennsylvania Germans | 0.3 /100 | #271 | Tragic $75,814 |