Cherokee vs Immigrants from Cuba Median Female Earnings
COMPARE
Cherokee
Immigrants from Cuba
Median Female Earnings
Median Female Earnings Comparison
Cherokee
Immigrants from Cuba
$34,742
MEDIAN FEMALE EARNINGS
0.0/ 100
METRIC RATING
316th/ 347
METRIC RANK
$33,291
MEDIAN FEMALE EARNINGS
0.0/ 100
METRIC RATING
338th/ 347
METRIC RANK
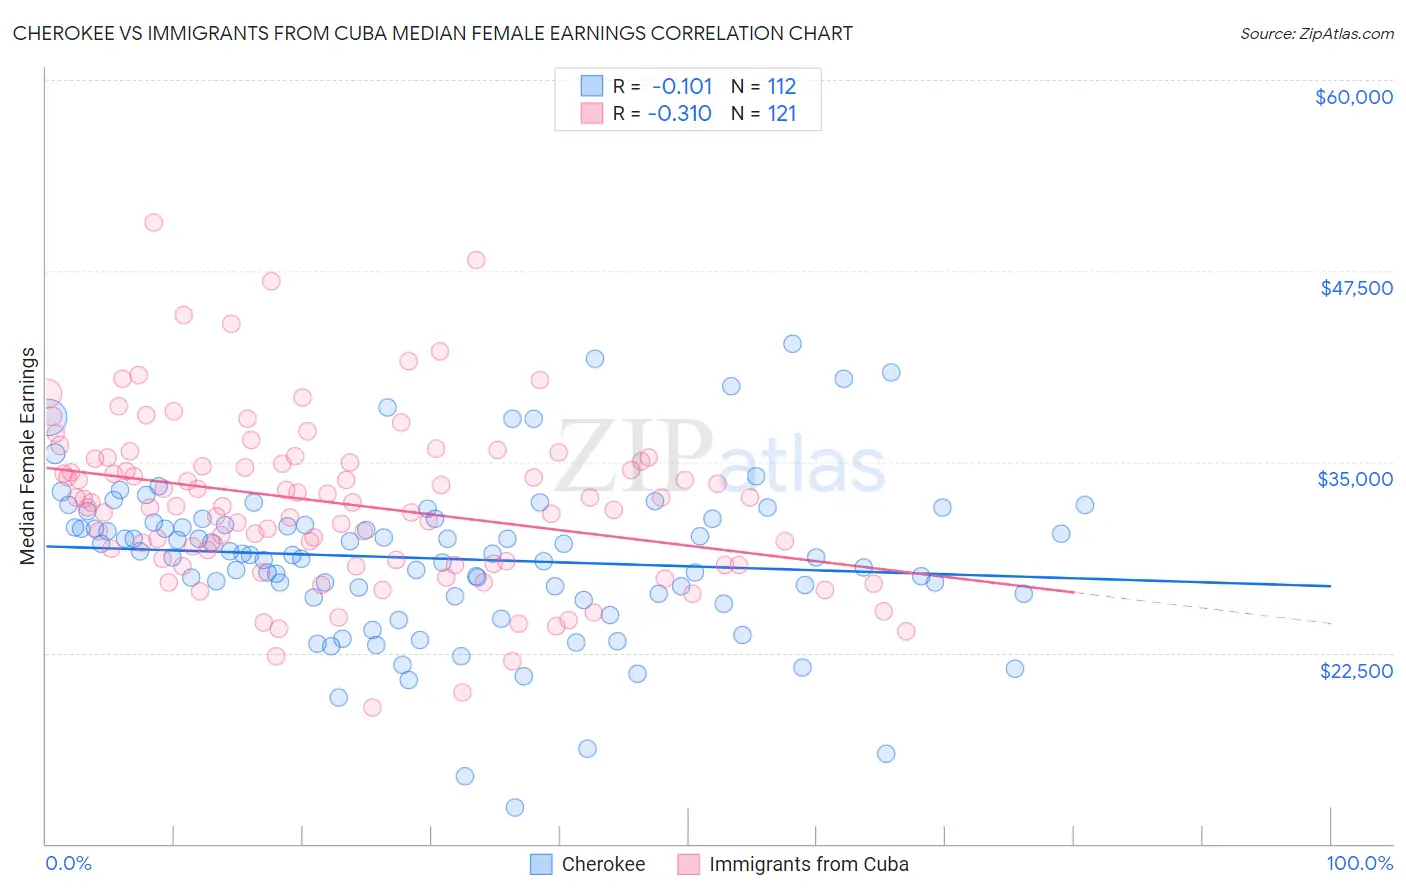
Cherokee vs Immigrants from Cuba Median Female Earnings Correlation Chart
The statistical analysis conducted on geographies consisting of 492,961,195 people shows a poor negative correlation between the proportion of Cherokee and median female earnings in the United States with a correlation coefficient (R) of -0.101 and weighted average of $34,742. Similarly, the statistical analysis conducted on geographies consisting of 325,881,101 people shows a mild negative correlation between the proportion of Immigrants from Cuba and median female earnings in the United States with a correlation coefficient (R) of -0.310 and weighted average of $33,291, a difference of 4.4%.
Median Female Earnings Correlation Summary
| Measurement | Cherokee | Immigrants from Cuba |
| Minimum | $12,396 | $18,945 |
| Maximum | $42,750 | $50,658 |
| Range | $30,354 | $31,713 |
| Mean | $28,662 | $32,289 |
| Median | $28,960 | $32,306 |
| Interquartile 25% (IQ1) | $26,268 | $28,389 |
| Interquartile 75% (IQ3) | $31,156 | $35,158 |
| Interquartile Range (IQR) | $4,888 | $6,769 |
| Standard Deviation (Sample) | $5,298 | $5,505 |
| Standard Deviation (Population) | $5,275 | $5,482 |
Similar Demographics by Median Female Earnings
Demographics Similar to Cherokee by Median Female Earnings
In terms of median female earnings, the demographic groups most similar to Cherokee are Potawatomi ($34,739, a difference of 0.010%), Immigrants from Yemen ($34,693, a difference of 0.14%), Pennsylvania German ($34,802, a difference of 0.17%), Shoshone ($34,677, a difference of 0.19%), and Immigrants from Honduras ($34,647, a difference of 0.27%).
| Demographics | Rating | Rank | Median Female Earnings |
| Hondurans | 0.0 /100 | #309 | Tragic $35,013 |
| Chippewa | 0.0 /100 | #310 | Tragic $35,003 |
| Ute | 0.0 /100 | #311 | Tragic $34,960 |
| Yaqui | 0.0 /100 | #312 | Tragic $34,943 |
| Cubans | 0.0 /100 | #313 | Tragic $34,942 |
| Apache | 0.0 /100 | #314 | Tragic $34,895 |
| Pennsylvania Germans | 0.0 /100 | #315 | Tragic $34,802 |
| Cherokee | 0.0 /100 | #316 | Tragic $34,742 |
| Potawatomi | 0.0 /100 | #317 | Tragic $34,739 |
| Immigrants | Yemen | 0.0 /100 | #318 | Tragic $34,693 |
| Shoshone | 0.0 /100 | #319 | Tragic $34,677 |
| Immigrants | Honduras | 0.0 /100 | #320 | Tragic $34,647 |
| Hispanics or Latinos | 0.0 /100 | #321 | Tragic $34,421 |
| Chickasaw | 0.0 /100 | #322 | Tragic $34,414 |
| Seminole | 0.0 /100 | #323 | Tragic $34,385 |
Demographics Similar to Immigrants from Cuba by Median Female Earnings
In terms of median female earnings, the demographic groups most similar to Immigrants from Cuba are Immigrants from Mexico ($33,236, a difference of 0.17%), Yakama ($33,354, a difference of 0.19%), Ottawa ($33,378, a difference of 0.26%), Tohono O'odham ($33,205, a difference of 0.26%), and Creek ($33,437, a difference of 0.44%).
| Demographics | Rating | Rank | Median Female Earnings |
| Natives/Alaskans | 0.0 /100 | #331 | Tragic $33,806 |
| Choctaw | 0.0 /100 | #332 | Tragic $33,775 |
| Mexicans | 0.0 /100 | #333 | Tragic $33,664 |
| Spanish American Indians | 0.0 /100 | #334 | Tragic $33,625 |
| Creek | 0.0 /100 | #335 | Tragic $33,437 |
| Ottawa | 0.0 /100 | #336 | Tragic $33,378 |
| Yakama | 0.0 /100 | #337 | Tragic $33,354 |
| Immigrants | Cuba | 0.0 /100 | #338 | Tragic $33,291 |
| Immigrants | Mexico | 0.0 /100 | #339 | Tragic $33,236 |
| Tohono O'odham | 0.0 /100 | #340 | Tragic $33,205 |
| Navajo | 0.0 /100 | #341 | Tragic $33,046 |
| Yup'ik | 0.0 /100 | #342 | Tragic $32,730 |
| Pueblo | 0.0 /100 | #343 | Tragic $32,564 |
| Lumbee | 0.0 /100 | #344 | Tragic $32,500 |
| Puerto Ricans | 0.0 /100 | #345 | Tragic $31,560 |