Jordanian vs Immigrants from Cuba Median Female Earnings
COMPARE
Jordanian
Immigrants from Cuba
Median Female Earnings
Median Female Earnings Comparison
Jordanians
Immigrants from Cuba
$41,464
MEDIAN FEMALE EARNINGS
97.5/ 100
METRIC RATING
108th/ 347
METRIC RANK
$33,291
MEDIAN FEMALE EARNINGS
0.0/ 100
METRIC RATING
338th/ 347
METRIC RANK
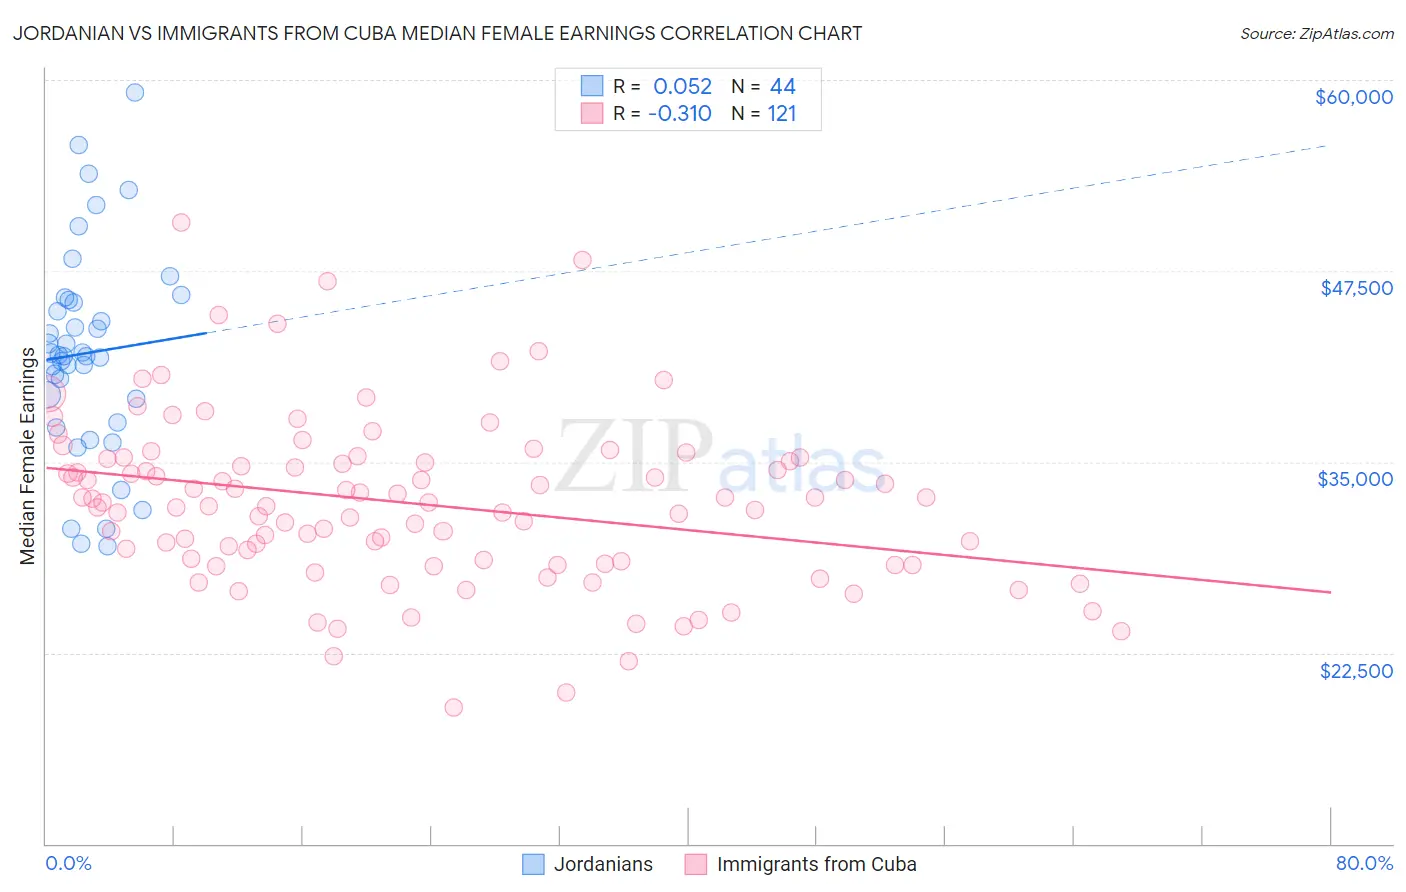
Jordanian vs Immigrants from Cuba Median Female Earnings Correlation Chart
The statistical analysis conducted on geographies consisting of 166,394,093 people shows a slight positive correlation between the proportion of Jordanians and median female earnings in the United States with a correlation coefficient (R) of 0.052 and weighted average of $41,464. Similarly, the statistical analysis conducted on geographies consisting of 325,881,101 people shows a mild negative correlation between the proportion of Immigrants from Cuba and median female earnings in the United States with a correlation coefficient (R) of -0.310 and weighted average of $33,291, a difference of 24.5%.
Median Female Earnings Correlation Summary
| Measurement | Jordanian | Immigrants from Cuba |
| Minimum | $29,450 | $18,945 |
| Maximum | $59,183 | $50,658 |
| Range | $29,733 | $31,713 |
| Mean | $42,125 | $32,289 |
| Median | $41,963 | $32,306 |
| Interquartile 25% (IQ1) | $38,328 | $28,389 |
| Interquartile 75% (IQ3) | $45,509 | $35,158 |
| Interquartile Range (IQR) | $7,181 | $6,769 |
| Standard Deviation (Sample) | $6,763 | $5,505 |
| Standard Deviation (Population) | $6,685 | $5,482 |
Similar Demographics by Median Female Earnings
Demographics Similar to Jordanians by Median Female Earnings
In terms of median female earnings, the demographic groups most similar to Jordanians are Chinese ($41,461, a difference of 0.010%), Immigrants from Eritrea ($41,485, a difference of 0.050%), Palestinian ($41,484, a difference of 0.050%), Italian ($41,505, a difference of 0.10%), and Immigrants from Zimbabwe ($41,527, a difference of 0.15%).
| Demographics | Rating | Rank | Median Female Earnings |
| Immigrants | Fiji | 98.3 /100 | #101 | Exceptional $41,656 |
| Immigrants | Poland | 98.2 /100 | #102 | Exceptional $41,630 |
| Immigrants | Argentina | 97.9 /100 | #103 | Exceptional $41,554 |
| Immigrants | Zimbabwe | 97.8 /100 | #104 | Exceptional $41,527 |
| Italians | 97.7 /100 | #105 | Exceptional $41,505 |
| Immigrants | Eritrea | 97.6 /100 | #106 | Exceptional $41,485 |
| Palestinians | 97.6 /100 | #107 | Exceptional $41,484 |
| Jordanians | 97.5 /100 | #108 | Exceptional $41,464 |
| Chinese | 97.5 /100 | #109 | Exceptional $41,461 |
| Immigrants | Western Asia | 97.0 /100 | #110 | Exceptional $41,375 |
| Immigrants | Canada | 97.0 /100 | #111 | Exceptional $41,373 |
| Immigrants | North America | 96.7 /100 | #112 | Exceptional $41,319 |
| Macedonians | 96.4 /100 | #113 | Exceptional $41,286 |
| Immigrants | England | 96.4 /100 | #114 | Exceptional $41,277 |
| Koreans | 96.4 /100 | #115 | Exceptional $41,276 |
Demographics Similar to Immigrants from Cuba by Median Female Earnings
In terms of median female earnings, the demographic groups most similar to Immigrants from Cuba are Immigrants from Mexico ($33,236, a difference of 0.17%), Yakama ($33,354, a difference of 0.19%), Ottawa ($33,378, a difference of 0.26%), Tohono O'odham ($33,205, a difference of 0.26%), and Creek ($33,437, a difference of 0.44%).
| Demographics | Rating | Rank | Median Female Earnings |
| Natives/Alaskans | 0.0 /100 | #331 | Tragic $33,806 |
| Choctaw | 0.0 /100 | #332 | Tragic $33,775 |
| Mexicans | 0.0 /100 | #333 | Tragic $33,664 |
| Spanish American Indians | 0.0 /100 | #334 | Tragic $33,625 |
| Creek | 0.0 /100 | #335 | Tragic $33,437 |
| Ottawa | 0.0 /100 | #336 | Tragic $33,378 |
| Yakama | 0.0 /100 | #337 | Tragic $33,354 |
| Immigrants | Cuba | 0.0 /100 | #338 | Tragic $33,291 |
| Immigrants | Mexico | 0.0 /100 | #339 | Tragic $33,236 |
| Tohono O'odham | 0.0 /100 | #340 | Tragic $33,205 |
| Navajo | 0.0 /100 | #341 | Tragic $33,046 |
| Yup'ik | 0.0 /100 | #342 | Tragic $32,730 |
| Pueblo | 0.0 /100 | #343 | Tragic $32,564 |
| Lumbee | 0.0 /100 | #344 | Tragic $32,500 |
| Puerto Ricans | 0.0 /100 | #345 | Tragic $31,560 |