Norwegian vs Immigrants from Cuba Median Female Earnings
COMPARE
Norwegian
Immigrants from Cuba
Median Female Earnings
Median Female Earnings Comparison
Norwegians
Immigrants from Cuba
$38,802
MEDIAN FEMALE EARNINGS
13.4/ 100
METRIC RATING
209th/ 347
METRIC RANK
$33,291
MEDIAN FEMALE EARNINGS
0.0/ 100
METRIC RATING
338th/ 347
METRIC RANK
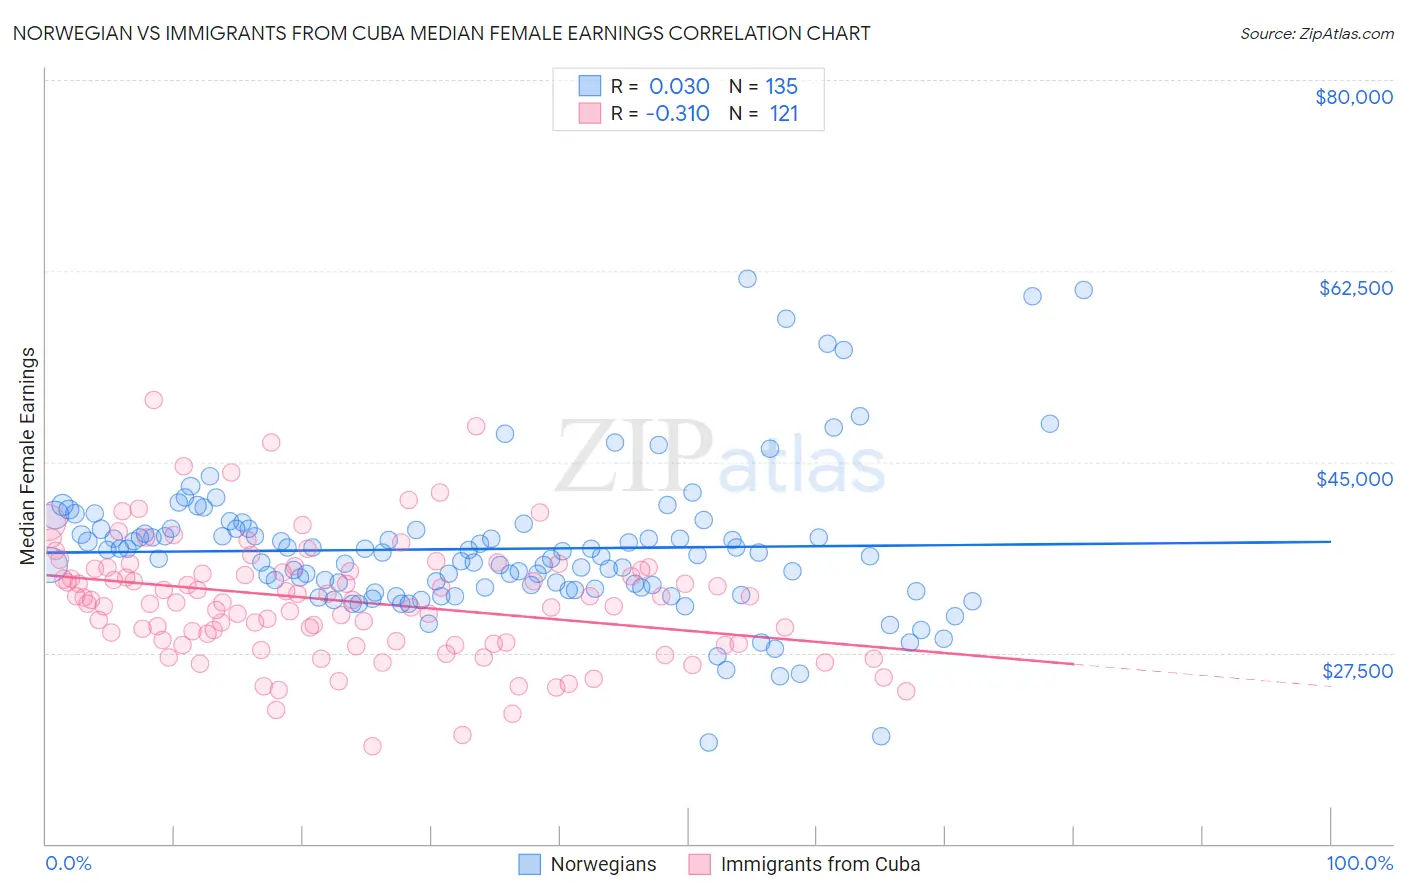
Norwegian vs Immigrants from Cuba Median Female Earnings Correlation Chart
The statistical analysis conducted on geographies consisting of 532,275,567 people shows no correlation between the proportion of Norwegians and median female earnings in the United States with a correlation coefficient (R) of 0.030 and weighted average of $38,802. Similarly, the statistical analysis conducted on geographies consisting of 325,881,101 people shows a mild negative correlation between the proportion of Immigrants from Cuba and median female earnings in the United States with a correlation coefficient (R) of -0.310 and weighted average of $33,291, a difference of 16.6%.
Median Female Earnings Correlation Summary
| Measurement | Norwegian | Immigrants from Cuba |
| Minimum | $19,310 | $18,945 |
| Maximum | $61,750 | $50,658 |
| Range | $42,440 | $31,713 |
| Mean | $37,022 | $32,289 |
| Median | $36,510 | $32,306 |
| Interquartile 25% (IQ1) | $33,325 | $28,389 |
| Interquartile 75% (IQ3) | $38,843 | $35,158 |
| Interquartile Range (IQR) | $5,519 | $6,769 |
| Standard Deviation (Sample) | $6,760 | $5,505 |
| Standard Deviation (Population) | $6,735 | $5,482 |
Similar Demographics by Median Female Earnings
Demographics Similar to Norwegians by Median Female Earnings
In terms of median female earnings, the demographic groups most similar to Norwegians are Immigrants from Thailand ($38,810, a difference of 0.020%), Immigrants from Cambodia ($38,833, a difference of 0.080%), Czechoslovakian ($38,738, a difference of 0.17%), Aleut ($38,719, a difference of 0.21%), and Immigrants from Bosnia and Herzegovina ($38,886, a difference of 0.22%).
| Demographics | Rating | Rank | Median Female Earnings |
| Slovaks | 19.9 /100 | #202 | Poor $39,029 |
| Czechs | 18.7 /100 | #203 | Poor $38,992 |
| Immigrants | Uruguay | 17.3 /100 | #204 | Poor $38,945 |
| Immigrants | Colombia | 16.3 /100 | #205 | Poor $38,913 |
| Immigrants | Bosnia and Herzegovina | 15.6 /100 | #206 | Poor $38,886 |
| Immigrants | Cambodia | 14.2 /100 | #207 | Poor $38,833 |
| Immigrants | Thailand | 13.6 /100 | #208 | Poor $38,810 |
| Norwegians | 13.4 /100 | #209 | Poor $38,802 |
| Czechoslovakians | 12.0 /100 | #210 | Poor $38,738 |
| Aleuts | 11.6 /100 | #211 | Poor $38,719 |
| Guamanians/Chamorros | 11.5 /100 | #212 | Poor $38,717 |
| Jamaicans | 10.5 /100 | #213 | Poor $38,670 |
| Iraqis | 10.5 /100 | #214 | Poor $38,666 |
| Spaniards | 10.3 /100 | #215 | Poor $38,656 |
| Immigrants | Ecuador | 10.1 /100 | #216 | Poor $38,644 |
Demographics Similar to Immigrants from Cuba by Median Female Earnings
In terms of median female earnings, the demographic groups most similar to Immigrants from Cuba are Immigrants from Mexico ($33,236, a difference of 0.17%), Yakama ($33,354, a difference of 0.19%), Ottawa ($33,378, a difference of 0.26%), Tohono O'odham ($33,205, a difference of 0.26%), and Creek ($33,437, a difference of 0.44%).
| Demographics | Rating | Rank | Median Female Earnings |
| Natives/Alaskans | 0.0 /100 | #331 | Tragic $33,806 |
| Choctaw | 0.0 /100 | #332 | Tragic $33,775 |
| Mexicans | 0.0 /100 | #333 | Tragic $33,664 |
| Spanish American Indians | 0.0 /100 | #334 | Tragic $33,625 |
| Creek | 0.0 /100 | #335 | Tragic $33,437 |
| Ottawa | 0.0 /100 | #336 | Tragic $33,378 |
| Yakama | 0.0 /100 | #337 | Tragic $33,354 |
| Immigrants | Cuba | 0.0 /100 | #338 | Tragic $33,291 |
| Immigrants | Mexico | 0.0 /100 | #339 | Tragic $33,236 |
| Tohono O'odham | 0.0 /100 | #340 | Tragic $33,205 |
| Navajo | 0.0 /100 | #341 | Tragic $33,046 |
| Yup'ik | 0.0 /100 | #342 | Tragic $32,730 |
| Pueblo | 0.0 /100 | #343 | Tragic $32,564 |
| Lumbee | 0.0 /100 | #344 | Tragic $32,500 |
| Puerto Ricans | 0.0 /100 | #345 | Tragic $31,560 |