Bahamian vs Immigrants from Cuba Median Female Earnings
COMPARE
Bahamian
Immigrants from Cuba
Median Female Earnings
Median Female Earnings Comparison
Bahamians
Immigrants from Cuba
$35,125
MEDIAN FEMALE EARNINGS
0.0/ 100
METRIC RATING
305th/ 347
METRIC RANK
$33,291
MEDIAN FEMALE EARNINGS
0.0/ 100
METRIC RATING
338th/ 347
METRIC RANK
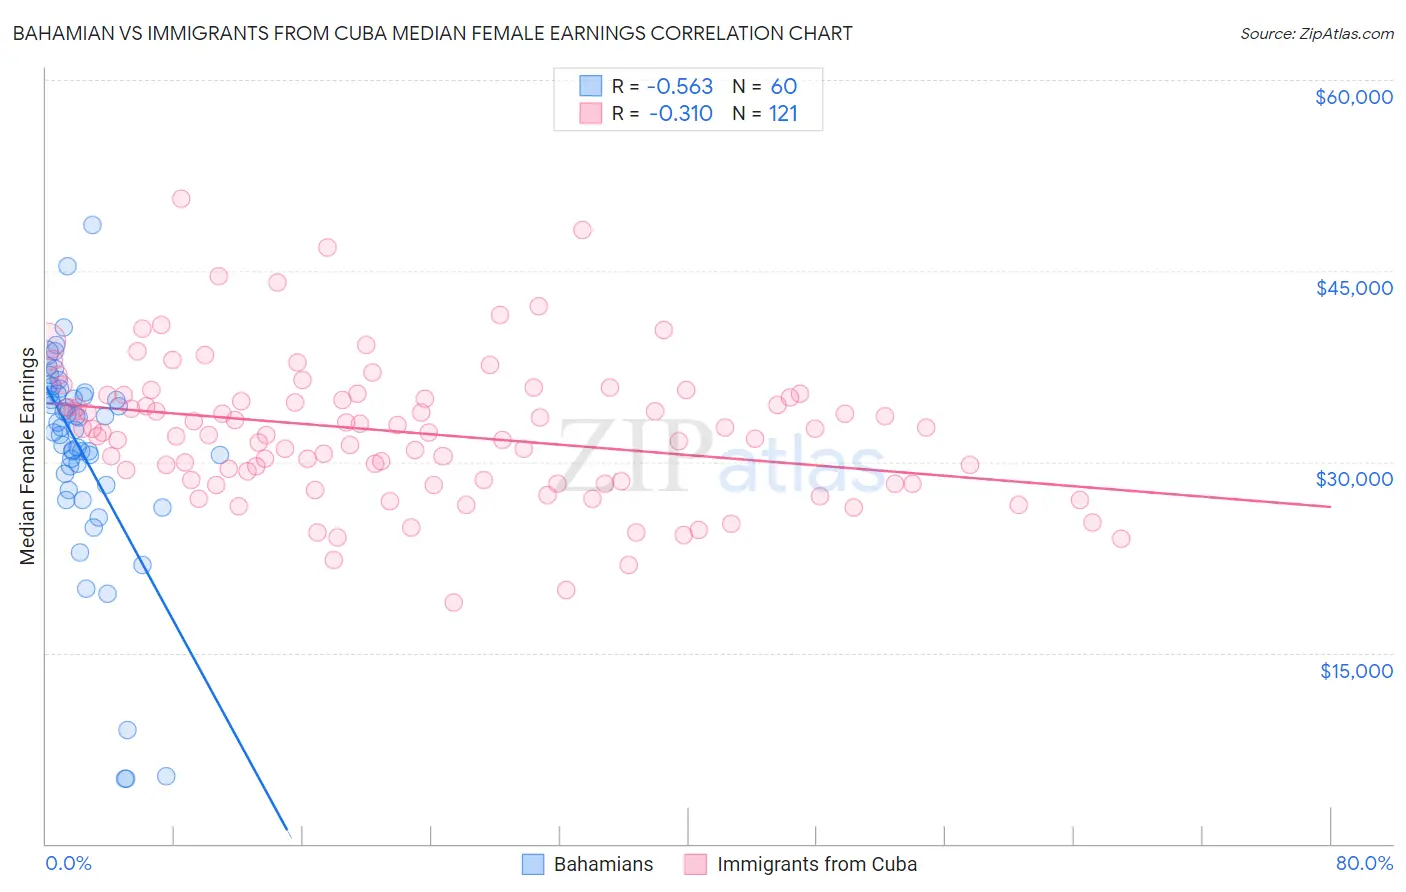
Bahamian vs Immigrants from Cuba Median Female Earnings Correlation Chart
The statistical analysis conducted on geographies consisting of 112,672,199 people shows a substantial negative correlation between the proportion of Bahamians and median female earnings in the United States with a correlation coefficient (R) of -0.563 and weighted average of $35,125. Similarly, the statistical analysis conducted on geographies consisting of 325,881,101 people shows a mild negative correlation between the proportion of Immigrants from Cuba and median female earnings in the United States with a correlation coefficient (R) of -0.310 and weighted average of $33,291, a difference of 5.5%.
Median Female Earnings Correlation Summary
| Measurement | Bahamian | Immigrants from Cuba |
| Minimum | $5,063 | $18,945 |
| Maximum | $48,590 | $50,658 |
| Range | $43,527 | $31,713 |
| Mean | $30,808 | $32,289 |
| Median | $32,617 | $32,306 |
| Interquartile 25% (IQ1) | $28,645 | $28,389 |
| Interquartile 75% (IQ3) | $35,290 | $35,158 |
| Interquartile Range (IQR) | $6,645 | $6,769 |
| Standard Deviation (Sample) | $8,476 | $5,505 |
| Standard Deviation (Population) | $8,405 | $5,482 |
Similar Demographics by Median Female Earnings
Demographics Similar to Bahamians by Median Female Earnings
In terms of median female earnings, the demographic groups most similar to Bahamians are Fijian ($35,114, a difference of 0.030%), Sioux ($35,063, a difference of 0.18%), Immigrants from Bahamas ($35,027, a difference of 0.28%), Honduran ($35,013, a difference of 0.32%), and Chippewa ($35,003, a difference of 0.35%).
| Demographics | Rating | Rank | Median Female Earnings |
| Immigrants | Micronesia | 0.0 /100 | #298 | Tragic $35,477 |
| Immigrants | Guatemala | 0.0 /100 | #299 | Tragic $35,444 |
| Yuman | 0.0 /100 | #300 | Tragic $35,377 |
| Pima | 0.0 /100 | #301 | Tragic $35,326 |
| Blacks/African Americans | 0.0 /100 | #302 | Tragic $35,315 |
| Immigrants | Latin America | 0.0 /100 | #303 | Tragic $35,307 |
| Crow | 0.0 /100 | #304 | Tragic $35,266 |
| Bahamians | 0.0 /100 | #305 | Tragic $35,125 |
| Fijians | 0.0 /100 | #306 | Tragic $35,114 |
| Sioux | 0.0 /100 | #307 | Tragic $35,063 |
| Immigrants | Bahamas | 0.0 /100 | #308 | Tragic $35,027 |
| Hondurans | 0.0 /100 | #309 | Tragic $35,013 |
| Chippewa | 0.0 /100 | #310 | Tragic $35,003 |
| Ute | 0.0 /100 | #311 | Tragic $34,960 |
| Yaqui | 0.0 /100 | #312 | Tragic $34,943 |
Demographics Similar to Immigrants from Cuba by Median Female Earnings
In terms of median female earnings, the demographic groups most similar to Immigrants from Cuba are Immigrants from Mexico ($33,236, a difference of 0.17%), Yakama ($33,354, a difference of 0.19%), Ottawa ($33,378, a difference of 0.26%), Tohono O'odham ($33,205, a difference of 0.26%), and Creek ($33,437, a difference of 0.44%).
| Demographics | Rating | Rank | Median Female Earnings |
| Natives/Alaskans | 0.0 /100 | #331 | Tragic $33,806 |
| Choctaw | 0.0 /100 | #332 | Tragic $33,775 |
| Mexicans | 0.0 /100 | #333 | Tragic $33,664 |
| Spanish American Indians | 0.0 /100 | #334 | Tragic $33,625 |
| Creek | 0.0 /100 | #335 | Tragic $33,437 |
| Ottawa | 0.0 /100 | #336 | Tragic $33,378 |
| Yakama | 0.0 /100 | #337 | Tragic $33,354 |
| Immigrants | Cuba | 0.0 /100 | #338 | Tragic $33,291 |
| Immigrants | Mexico | 0.0 /100 | #339 | Tragic $33,236 |
| Tohono O'odham | 0.0 /100 | #340 | Tragic $33,205 |
| Navajo | 0.0 /100 | #341 | Tragic $33,046 |
| Yup'ik | 0.0 /100 | #342 | Tragic $32,730 |
| Pueblo | 0.0 /100 | #343 | Tragic $32,564 |
| Lumbee | 0.0 /100 | #344 | Tragic $32,500 |
| Puerto Ricans | 0.0 /100 | #345 | Tragic $31,560 |