Puerto Rican vs Immigrants from Cuba Median Female Earnings
COMPARE
Puerto Rican
Immigrants from Cuba
Median Female Earnings
Median Female Earnings Comparison
Puerto Ricans
Immigrants from Cuba
$31,560
MEDIAN FEMALE EARNINGS
0.0/ 100
METRIC RATING
345th/ 347
METRIC RANK
$33,291
MEDIAN FEMALE EARNINGS
0.0/ 100
METRIC RATING
338th/ 347
METRIC RANK
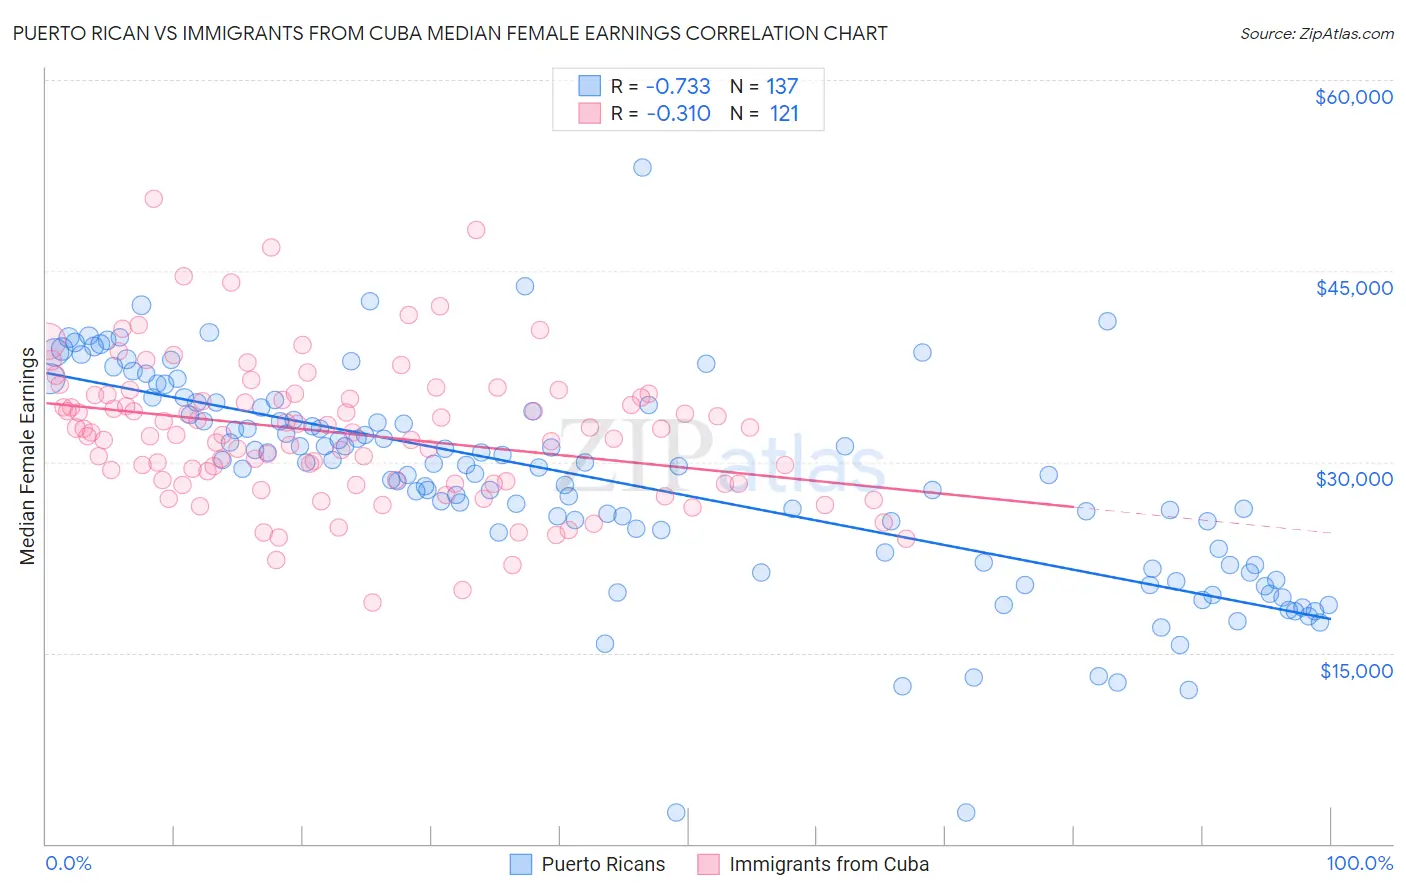
Puerto Rican vs Immigrants from Cuba Median Female Earnings Correlation Chart
The statistical analysis conducted on geographies consisting of 527,573,367 people shows a strong negative correlation between the proportion of Puerto Ricans and median female earnings in the United States with a correlation coefficient (R) of -0.733 and weighted average of $31,560. Similarly, the statistical analysis conducted on geographies consisting of 325,881,101 people shows a mild negative correlation between the proportion of Immigrants from Cuba and median female earnings in the United States with a correlation coefficient (R) of -0.310 and weighted average of $33,291, a difference of 5.5%.
Median Female Earnings Correlation Summary
| Measurement | Puerto Rican | Immigrants from Cuba |
| Minimum | $2,499 | $18,945 |
| Maximum | $53,092 | $50,658 |
| Range | $50,593 | $31,713 |
| Mean | $28,571 | $32,289 |
| Median | $29,640 | $32,306 |
| Interquartile 25% (IQ1) | $21,994 | $28,389 |
| Interquartile 75% (IQ3) | $34,369 | $35,158 |
| Interquartile Range (IQR) | $12,375 | $6,769 |
| Standard Deviation (Sample) | $8,353 | $5,505 |
| Standard Deviation (Population) | $8,323 | $5,482 |
Demographics Similar to Puerto Ricans and Immigrants from Cuba by Median Female Earnings
In terms of median female earnings, the demographic groups most similar to Puerto Ricans are Arapaho ($31,489, a difference of 0.23%), Lumbee ($32,500, a difference of 3.0%), Pueblo ($32,564, a difference of 3.2%), Yup'ik ($32,730, a difference of 3.7%), and Houma ($30,343, a difference of 4.0%). Similarly, the demographic groups most similar to Immigrants from Cuba are Immigrants from Mexico ($33,236, a difference of 0.17%), Yakama ($33,354, a difference of 0.19%), Ottawa ($33,378, a difference of 0.26%), Tohono O'odham ($33,205, a difference of 0.26%), and Creek ($33,437, a difference of 0.44%).
| Demographics | Rating | Rank | Median Female Earnings |
| Immigrants | Central America | 0.0 /100 | #328 | Tragic $33,953 |
| Hopi | 0.0 /100 | #329 | Tragic $33,932 |
| Menominee | 0.0 /100 | #330 | Tragic $33,894 |
| Natives/Alaskans | 0.0 /100 | #331 | Tragic $33,806 |
| Choctaw | 0.0 /100 | #332 | Tragic $33,775 |
| Mexicans | 0.0 /100 | #333 | Tragic $33,664 |
| Spanish American Indians | 0.0 /100 | #334 | Tragic $33,625 |
| Creek | 0.0 /100 | #335 | Tragic $33,437 |
| Ottawa | 0.0 /100 | #336 | Tragic $33,378 |
| Yakama | 0.0 /100 | #337 | Tragic $33,354 |
| Immigrants | Cuba | 0.0 /100 | #338 | Tragic $33,291 |
| Immigrants | Mexico | 0.0 /100 | #339 | Tragic $33,236 |
| Tohono O'odham | 0.0 /100 | #340 | Tragic $33,205 |
| Navajo | 0.0 /100 | #341 | Tragic $33,046 |
| Yup'ik | 0.0 /100 | #342 | Tragic $32,730 |
| Pueblo | 0.0 /100 | #343 | Tragic $32,564 |
| Lumbee | 0.0 /100 | #344 | Tragic $32,500 |
| Puerto Ricans | 0.0 /100 | #345 | Tragic $31,560 |
| Arapaho | 0.0 /100 | #346 | Tragic $31,489 |
| Houma | 0.0 /100 | #347 | Tragic $30,343 |