Cherokee vs Immigrants from Barbados Median Female Earnings
COMPARE
Cherokee
Immigrants from Barbados
Median Female Earnings
Median Female Earnings Comparison
Cherokee
Immigrants from Barbados
$34,742
MEDIAN FEMALE EARNINGS
0.0/ 100
METRIC RATING
316th/ 347
METRIC RANK
$41,685
MEDIAN FEMALE EARNINGS
98.4/ 100
METRIC RATING
99th/ 347
METRIC RANK
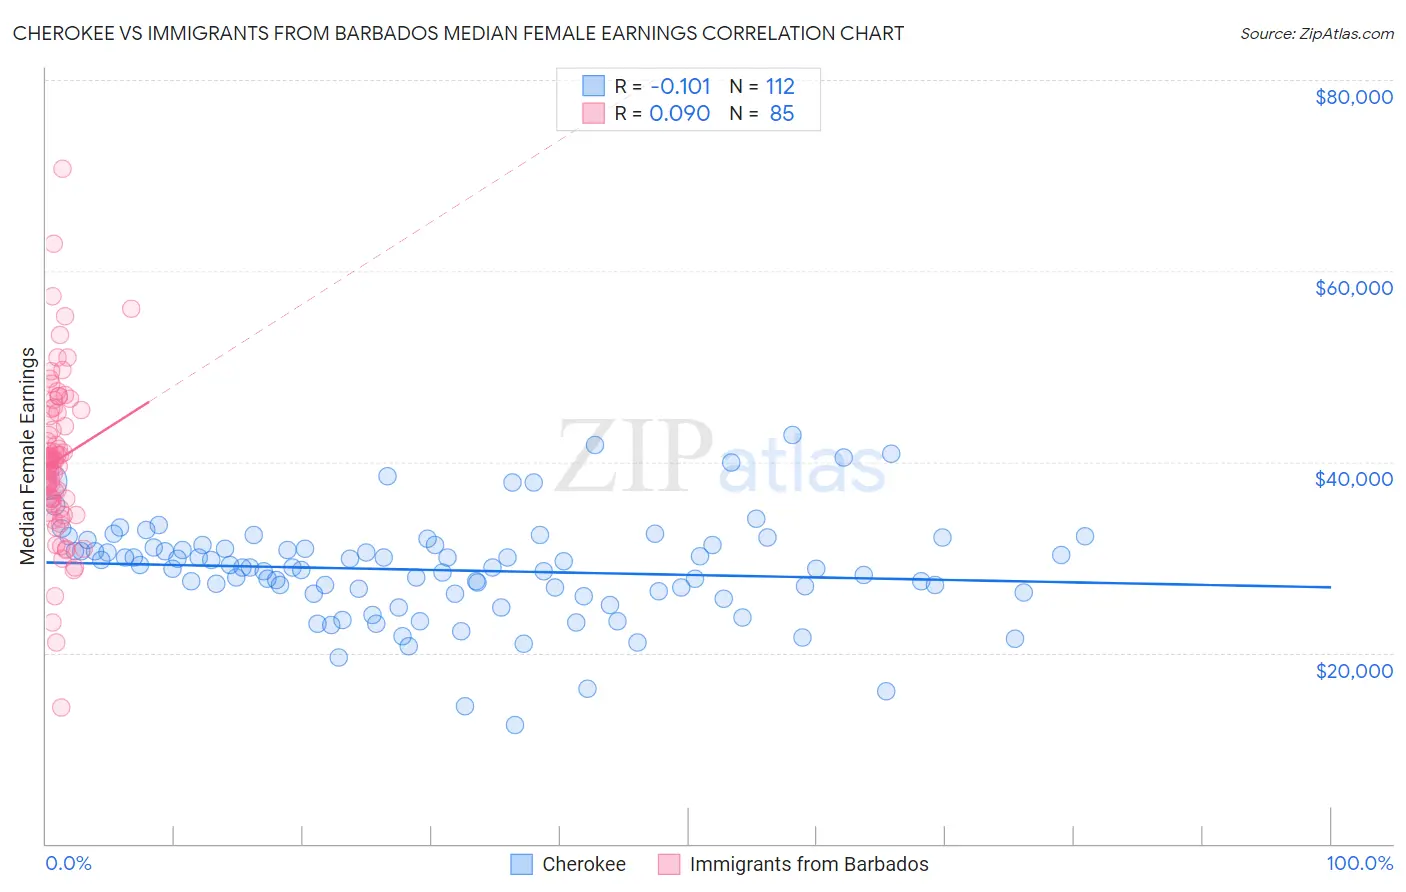
Cherokee vs Immigrants from Barbados Median Female Earnings Correlation Chart
The statistical analysis conducted on geographies consisting of 492,961,195 people shows a poor negative correlation between the proportion of Cherokee and median female earnings in the United States with a correlation coefficient (R) of -0.101 and weighted average of $34,742. Similarly, the statistical analysis conducted on geographies consisting of 112,771,231 people shows a slight positive correlation between the proportion of Immigrants from Barbados and median female earnings in the United States with a correlation coefficient (R) of 0.090 and weighted average of $41,685, a difference of 20.0%.
Median Female Earnings Correlation Summary
| Measurement | Cherokee | Immigrants from Barbados |
| Minimum | $12,396 | $14,324 |
| Maximum | $42,750 | $70,712 |
| Range | $30,354 | $56,388 |
| Mean | $28,662 | $40,171 |
| Median | $28,960 | $40,011 |
| Interquartile 25% (IQ1) | $26,268 | $35,731 |
| Interquartile 75% (IQ3) | $31,156 | $45,302 |
| Interquartile Range (IQR) | $4,888 | $9,570 |
| Standard Deviation (Sample) | $5,298 | $8,566 |
| Standard Deviation (Population) | $5,275 | $8,515 |
Similar Demographics by Median Female Earnings
Demographics Similar to Cherokee by Median Female Earnings
In terms of median female earnings, the demographic groups most similar to Cherokee are Potawatomi ($34,739, a difference of 0.010%), Immigrants from Yemen ($34,693, a difference of 0.14%), Pennsylvania German ($34,802, a difference of 0.17%), Shoshone ($34,677, a difference of 0.19%), and Immigrants from Honduras ($34,647, a difference of 0.27%).
| Demographics | Rating | Rank | Median Female Earnings |
| Hondurans | 0.0 /100 | #309 | Tragic $35,013 |
| Chippewa | 0.0 /100 | #310 | Tragic $35,003 |
| Ute | 0.0 /100 | #311 | Tragic $34,960 |
| Yaqui | 0.0 /100 | #312 | Tragic $34,943 |
| Cubans | 0.0 /100 | #313 | Tragic $34,942 |
| Apache | 0.0 /100 | #314 | Tragic $34,895 |
| Pennsylvania Germans | 0.0 /100 | #315 | Tragic $34,802 |
| Cherokee | 0.0 /100 | #316 | Tragic $34,742 |
| Potawatomi | 0.0 /100 | #317 | Tragic $34,739 |
| Immigrants | Yemen | 0.0 /100 | #318 | Tragic $34,693 |
| Shoshone | 0.0 /100 | #319 | Tragic $34,677 |
| Immigrants | Honduras | 0.0 /100 | #320 | Tragic $34,647 |
| Hispanics or Latinos | 0.0 /100 | #321 | Tragic $34,421 |
| Chickasaw | 0.0 /100 | #322 | Tragic $34,414 |
| Seminole | 0.0 /100 | #323 | Tragic $34,385 |
Demographics Similar to Immigrants from Barbados by Median Female Earnings
In terms of median female earnings, the demographic groups most similar to Immigrants from Barbados are Romanian ($41,663, a difference of 0.050%), Immigrants from Fiji ($41,656, a difference of 0.070%), Immigrants from Poland ($41,630, a difference of 0.13%), Immigrants from Scotland ($41,771, a difference of 0.21%), and Immigrants from Argentina ($41,554, a difference of 0.31%).
| Demographics | Rating | Rank | Median Female Earnings |
| Argentineans | 99.1 /100 | #92 | Exceptional $41,952 |
| Immigrants | Grenada | 99.0 /100 | #93 | Exceptional $41,932 |
| Moroccans | 98.9 /100 | #94 | Exceptional $41,872 |
| Immigrants | Netherlands | 98.9 /100 | #95 | Exceptional $41,870 |
| South Africans | 98.8 /100 | #96 | Exceptional $41,825 |
| Immigrants | Hungary | 98.8 /100 | #97 | Exceptional $41,820 |
| Immigrants | Scotland | 98.7 /100 | #98 | Exceptional $41,771 |
| Immigrants | Barbados | 98.4 /100 | #99 | Exceptional $41,685 |
| Romanians | 98.3 /100 | #100 | Exceptional $41,663 |
| Immigrants | Fiji | 98.3 /100 | #101 | Exceptional $41,656 |
| Immigrants | Poland | 98.2 /100 | #102 | Exceptional $41,630 |
| Immigrants | Argentina | 97.9 /100 | #103 | Exceptional $41,554 |
| Immigrants | Zimbabwe | 97.8 /100 | #104 | Exceptional $41,527 |
| Italians | 97.7 /100 | #105 | Exceptional $41,505 |
| Immigrants | Eritrea | 97.6 /100 | #106 | Exceptional $41,485 |