Immigrants from Chile vs Immigrants from Cuba Median Female Earnings
COMPARE
Immigrants from Chile
Immigrants from Cuba
Median Female Earnings
Median Female Earnings Comparison
Immigrants from Chile
Immigrants from Cuba
$40,353
MEDIAN FEMALE EARNINGS
79.6/ 100
METRIC RATING
150th/ 347
METRIC RANK
$33,291
MEDIAN FEMALE EARNINGS
0.0/ 100
METRIC RATING
338th/ 347
METRIC RANK
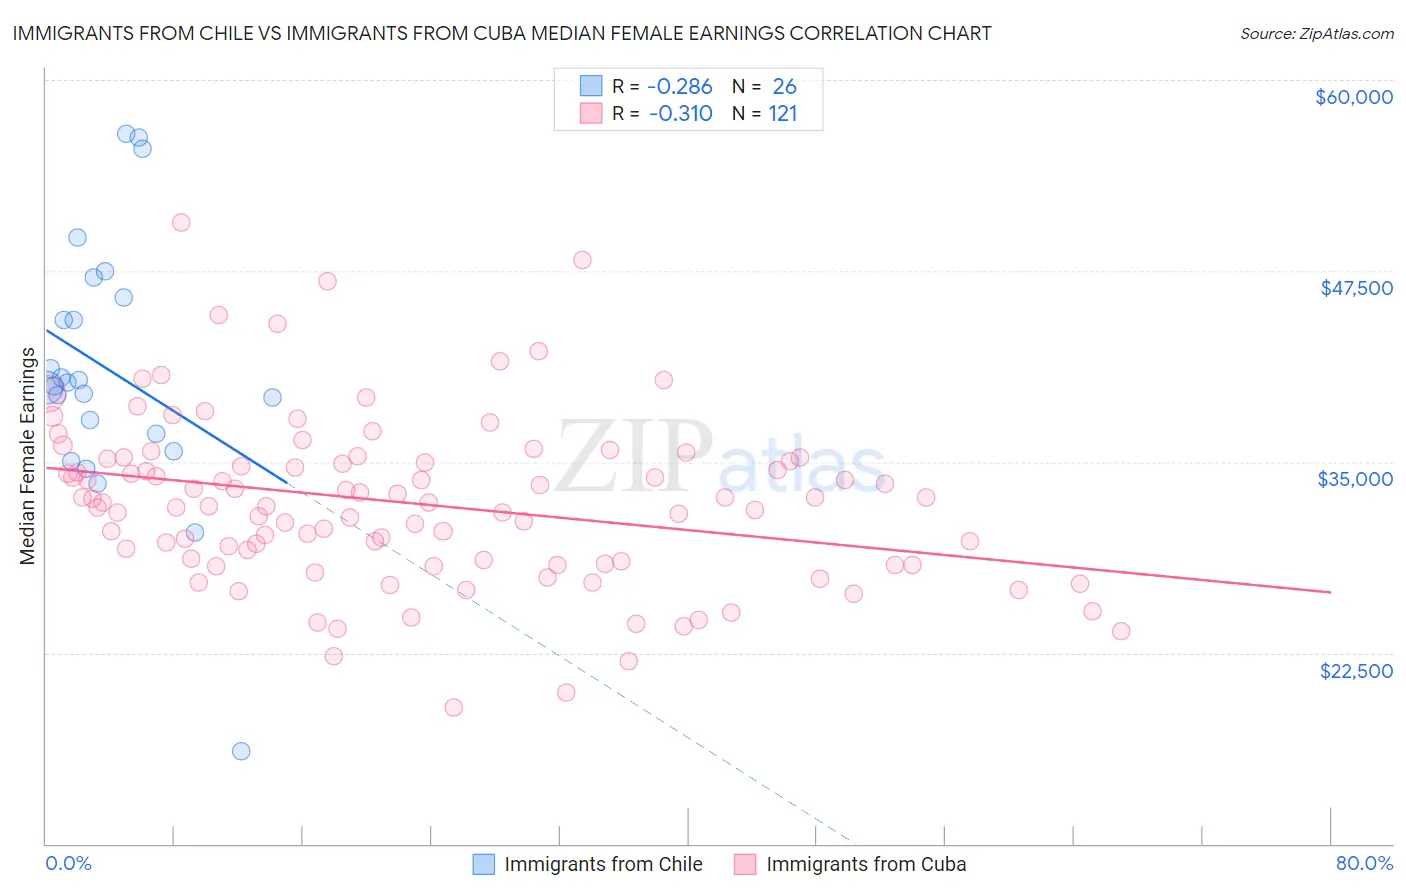
Immigrants from Chile vs Immigrants from Cuba Median Female Earnings Correlation Chart
The statistical analysis conducted on geographies consisting of 218,612,520 people shows a weak negative correlation between the proportion of Immigrants from Chile and median female earnings in the United States with a correlation coefficient (R) of -0.286 and weighted average of $40,353. Similarly, the statistical analysis conducted on geographies consisting of 325,881,101 people shows a mild negative correlation between the proportion of Immigrants from Cuba and median female earnings in the United States with a correlation coefficient (R) of -0.310 and weighted average of $33,291, a difference of 21.2%.
Median Female Earnings Correlation Summary
| Measurement | Immigrants from Chile | Immigrants from Cuba |
| Minimum | $16,042 | $18,945 |
| Maximum | $56,442 | $50,658 |
| Range | $40,400 | $31,713 |
| Mean | $41,031 | $32,289 |
| Median | $40,109 | $32,306 |
| Interquartile 25% (IQ1) | $36,875 | $28,389 |
| Interquartile 75% (IQ3) | $45,789 | $35,158 |
| Interquartile Range (IQR) | $8,914 | $6,769 |
| Standard Deviation (Sample) | $8,520 | $5,505 |
| Standard Deviation (Population) | $8,355 | $5,482 |
Similar Demographics by Median Female Earnings
Demographics Similar to Immigrants from Chile by Median Female Earnings
In terms of median female earnings, the demographic groups most similar to Immigrants from Chile are Immigrants from Cameroon ($40,354, a difference of 0.0%), Immigrants from Armenia ($40,340, a difference of 0.030%), Polish ($40,371, a difference of 0.040%), Vietnamese ($40,377, a difference of 0.060%), and West Indian ($40,317, a difference of 0.090%).
| Demographics | Rating | Rank | Median Female Earnings |
| Northern Europeans | 83.9 /100 | #143 | Excellent $40,491 |
| Immigrants | North Macedonia | 83.8 /100 | #144 | Excellent $40,488 |
| Brazilians | 83.6 /100 | #145 | Excellent $40,483 |
| Ghanaians | 82.1 /100 | #146 | Excellent $40,429 |
| Vietnamese | 80.4 /100 | #147 | Excellent $40,377 |
| Poles | 80.2 /100 | #148 | Excellent $40,371 |
| Immigrants | Cameroon | 79.7 /100 | #149 | Good $40,354 |
| Immigrants | Chile | 79.6 /100 | #150 | Good $40,353 |
| Immigrants | Armenia | 79.2 /100 | #151 | Good $40,340 |
| West Indians | 78.4 /100 | #152 | Good $40,317 |
| British West Indians | 77.7 /100 | #153 | Good $40,299 |
| Immigrants | Oceania | 77.6 /100 | #154 | Good $40,297 |
| Immigrants | Africa | 76.2 /100 | #155 | Good $40,257 |
| Peruvians | 75.3 /100 | #156 | Good $40,234 |
| Portuguese | 73.0 /100 | #157 | Good $40,177 |
Demographics Similar to Immigrants from Cuba by Median Female Earnings
In terms of median female earnings, the demographic groups most similar to Immigrants from Cuba are Immigrants from Mexico ($33,236, a difference of 0.17%), Yakama ($33,354, a difference of 0.19%), Ottawa ($33,378, a difference of 0.26%), Tohono O'odham ($33,205, a difference of 0.26%), and Creek ($33,437, a difference of 0.44%).
| Demographics | Rating | Rank | Median Female Earnings |
| Natives/Alaskans | 0.0 /100 | #331 | Tragic $33,806 |
| Choctaw | 0.0 /100 | #332 | Tragic $33,775 |
| Mexicans | 0.0 /100 | #333 | Tragic $33,664 |
| Spanish American Indians | 0.0 /100 | #334 | Tragic $33,625 |
| Creek | 0.0 /100 | #335 | Tragic $33,437 |
| Ottawa | 0.0 /100 | #336 | Tragic $33,378 |
| Yakama | 0.0 /100 | #337 | Tragic $33,354 |
| Immigrants | Cuba | 0.0 /100 | #338 | Tragic $33,291 |
| Immigrants | Mexico | 0.0 /100 | #339 | Tragic $33,236 |
| Tohono O'odham | 0.0 /100 | #340 | Tragic $33,205 |
| Navajo | 0.0 /100 | #341 | Tragic $33,046 |
| Yup'ik | 0.0 /100 | #342 | Tragic $32,730 |
| Pueblo | 0.0 /100 | #343 | Tragic $32,564 |
| Lumbee | 0.0 /100 | #344 | Tragic $32,500 |
| Puerto Ricans | 0.0 /100 | #345 | Tragic $31,560 |