Mexican vs Hungarian Householder Income Over 65 years
COMPARE
Mexican
Hungarian
Householder Income Over 65 years
Householder Income Over 65 years Comparison
Mexicans
Hungarians
$53,897
HOUSEHOLDER INCOME OVER 65 YEARS
0.1/ 100
METRIC RATING
285th/ 347
METRIC RANK
$61,673
HOUSEHOLDER INCOME OVER 65 YEARS
67.7/ 100
METRIC RATING
151st/ 347
METRIC RANK
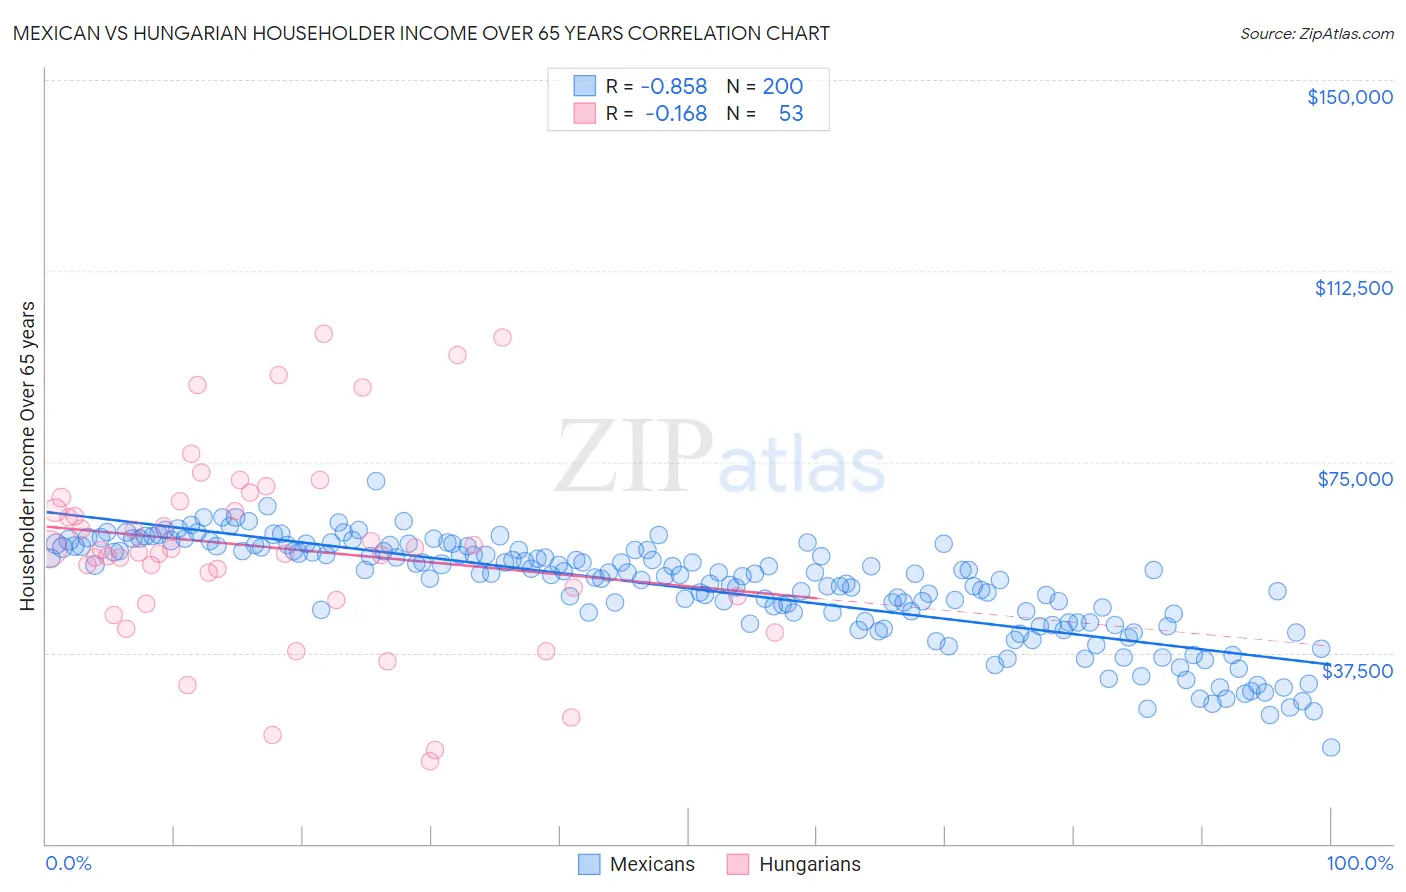
Mexican vs Hungarian Householder Income Over 65 years Correlation Chart
The statistical analysis conducted on geographies consisting of 559,960,320 people shows a very strong negative correlation between the proportion of Mexicans and household income with householder over the age of 65 in the United States with a correlation coefficient (R) of -0.858 and weighted average of $53,897. Similarly, the statistical analysis conducted on geographies consisting of 483,949,327 people shows a poor negative correlation between the proportion of Hungarians and household income with householder over the age of 65 in the United States with a correlation coefficient (R) of -0.168 and weighted average of $61,673, a difference of 14.4%.
Householder Income Over 65 years Correlation Summary
| Measurement | Mexican | Hungarian |
| Minimum | $18,818 | $16,250 |
| Maximum | $71,178 | $100,190 |
| Range | $52,360 | $83,940 |
| Mean | $50,150 | $58,276 |
| Median | $52,997 | $57,812 |
| Interquartile 25% (IQ1) | $43,543 | $48,254 |
| Interquartile 75% (IQ3) | $58,155 | $67,733 |
| Interquartile Range (IQR) | $14,612 | $19,479 |
| Standard Deviation (Sample) | $10,117 | $18,944 |
| Standard Deviation (Population) | $10,091 | $18,765 |
Similar Demographics by Householder Income Over 65 years
Demographics Similar to Mexicans by Householder Income Over 65 years
In terms of householder income over 65 years, the demographic groups most similar to Mexicans are Chippewa ($53,847, a difference of 0.090%), Immigrants from Guatemala ($53,950, a difference of 0.10%), Immigrants from Liberia ($53,967, a difference of 0.13%), Immigrants from Armenia ($53,974, a difference of 0.14%), and Somali ($54,004, a difference of 0.20%).
| Demographics | Rating | Rank | Householder Income Over 65 years |
| Immigrants | Ecuador | 0.1 /100 | #278 | Tragic $54,030 |
| Blackfeet | 0.1 /100 | #279 | Tragic $54,029 |
| Immigrants | Jamaica | 0.1 /100 | #280 | Tragic $54,027 |
| Somalis | 0.1 /100 | #281 | Tragic $54,004 |
| Immigrants | Armenia | 0.1 /100 | #282 | Tragic $53,974 |
| Immigrants | Liberia | 0.1 /100 | #283 | Tragic $53,967 |
| Immigrants | Guatemala | 0.1 /100 | #284 | Tragic $53,950 |
| Mexicans | 0.1 /100 | #285 | Tragic $53,897 |
| Chippewa | 0.1 /100 | #286 | Tragic $53,847 |
| Immigrants | Barbados | 0.1 /100 | #287 | Tragic $53,766 |
| Paiute | 0.1 /100 | #288 | Tragic $53,762 |
| Iroquois | 0.1 /100 | #289 | Tragic $53,737 |
| Chickasaw | 0.1 /100 | #290 | Tragic $53,732 |
| Africans | 0.0 /100 | #291 | Tragic $53,711 |
| Shoshone | 0.0 /100 | #292 | Tragic $53,681 |
Demographics Similar to Hungarians by Householder Income Over 65 years
In terms of householder income over 65 years, the demographic groups most similar to Hungarians are Armenian ($61,656, a difference of 0.030%), Slavic ($61,709, a difference of 0.060%), Costa Rican ($61,638, a difference of 0.060%), Swiss ($61,621, a difference of 0.080%), and Scottish ($61,735, a difference of 0.10%).
| Demographics | Rating | Rank | Householder Income Over 65 years |
| Immigrants | Peru | 74.4 /100 | #144 | Good $61,988 |
| Immigrants | Uganda | 74.2 /100 | #145 | Good $61,976 |
| Immigrants | Southern Europe | 72.7 /100 | #146 | Good $61,902 |
| Immigrants | Nepal | 71.4 /100 | #147 | Good $61,843 |
| Alsatians | 70.5 /100 | #148 | Good $61,797 |
| Scottish | 69.1 /100 | #149 | Good $61,735 |
| Slavs | 68.5 /100 | #150 | Good $61,709 |
| Hungarians | 67.7 /100 | #151 | Good $61,673 |
| Armenians | 67.3 /100 | #152 | Good $61,656 |
| Costa Ricans | 66.9 /100 | #153 | Good $61,638 |
| Swiss | 66.5 /100 | #154 | Good $61,621 |
| Poles | 65.9 /100 | #155 | Good $61,598 |
| Scandinavians | 65.6 /100 | #156 | Good $61,586 |
| Macedonians | 65.1 /100 | #157 | Good $61,564 |
| English | 63.3 /100 | #158 | Good $61,487 |