Cherokee vs Barbadian Householder Income Over 65 years
COMPARE
Cherokee
Barbadian
Householder Income Over 65 years
Householder Income Over 65 years Comparison
Cherokee
Barbadians
$54,133
HOUSEHOLDER INCOME OVER 65 YEARS
0.1/ 100
METRIC RATING
275th/ 347
METRIC RANK
$54,163
HOUSEHOLDER INCOME OVER 65 YEARS
0.1/ 100
METRIC RATING
274th/ 347
METRIC RANK
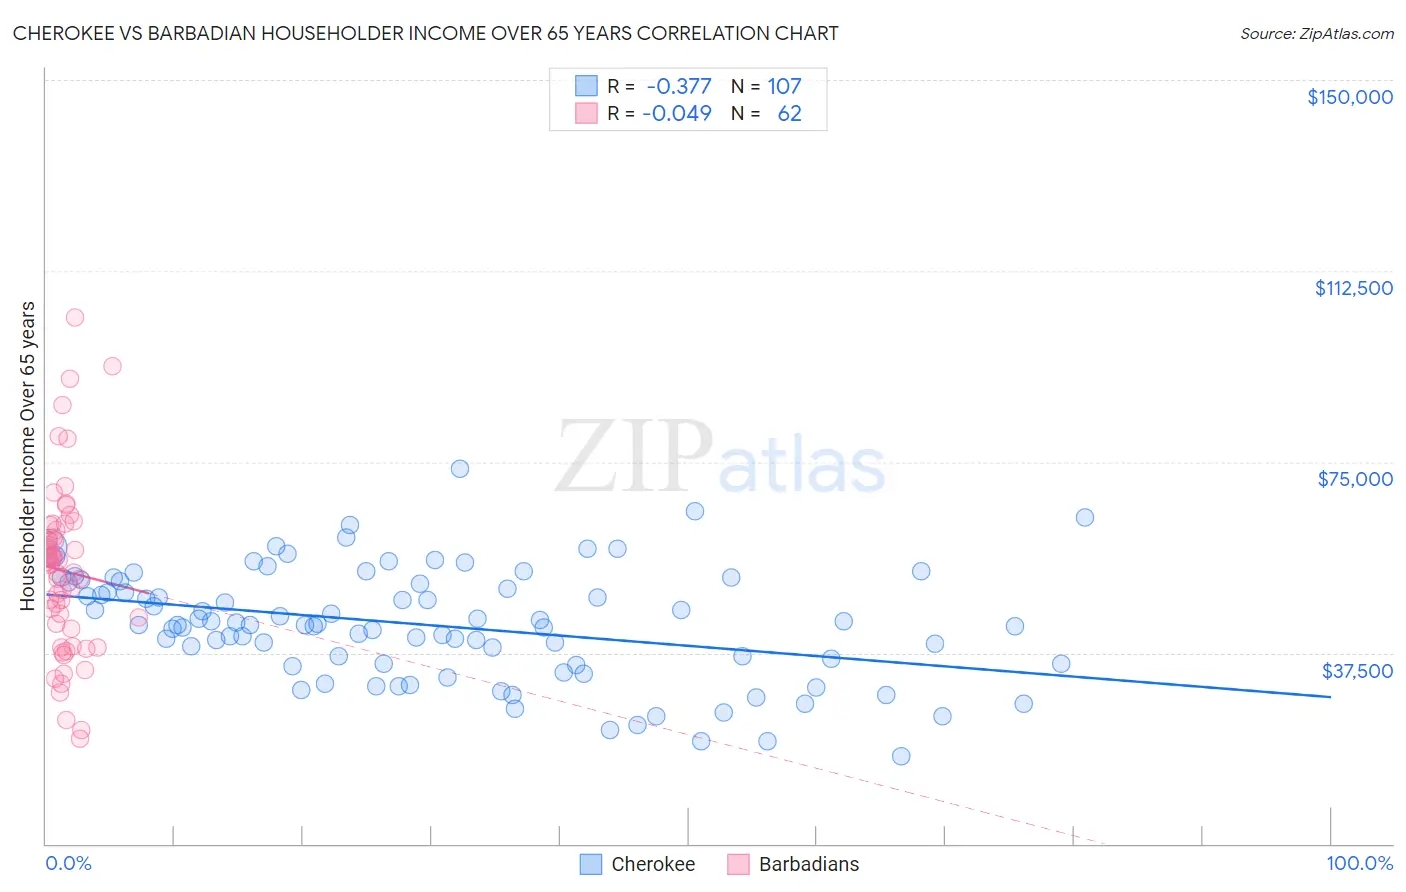
Cherokee vs Barbadian Householder Income Over 65 years Correlation Chart
The statistical analysis conducted on geographies consisting of 490,908,183 people shows a mild negative correlation between the proportion of Cherokee and household income with householder over the age of 65 in the United States with a correlation coefficient (R) of -0.377 and weighted average of $54,133. Similarly, the statistical analysis conducted on geographies consisting of 141,115,722 people shows no correlation between the proportion of Barbadians and household income with householder over the age of 65 in the United States with a correlation coefficient (R) of -0.049 and weighted average of $54,163, a difference of 0.060%.
Householder Income Over 65 years Correlation Summary
| Measurement | Cherokee | Barbadian |
| Minimum | $17,188 | $20,697 |
| Maximum | $73,750 | $103,317 |
| Range | $56,562 | $82,620 |
| Mean | $42,917 | $53,555 |
| Median | $42,899 | $54,900 |
| Interquartile 25% (IQ1) | $35,369 | $42,188 |
| Interquartile 75% (IQ3) | $51,355 | $61,698 |
| Interquartile Range (IQR) | $15,986 | $19,510 |
| Standard Deviation (Sample) | $10,957 | $16,744 |
| Standard Deviation (Population) | $10,906 | $16,609 |
Demographics Similar to Cherokee and Barbadians by Householder Income Over 65 years
In terms of householder income over 65 years, the demographic groups most similar to Cherokee are Cree ($54,129, a difference of 0.010%), Cheyenne ($54,096, a difference of 0.070%), Indonesian ($54,176, a difference of 0.080%), Potawatomi ($54,212, a difference of 0.15%), and Immigrants from Ecuador ($54,030, a difference of 0.19%). Similarly, the demographic groups most similar to Barbadians are Indonesian ($54,176, a difference of 0.020%), Cree ($54,129, a difference of 0.060%), Potawatomi ($54,212, a difference of 0.090%), Cheyenne ($54,096, a difference of 0.12%), and Immigrants from Ecuador ($54,030, a difference of 0.25%).
| Demographics | Rating | Rank | Householder Income Over 65 years |
| Apache | 0.1 /100 | #264 | Tragic $54,668 |
| Belizeans | 0.1 /100 | #265 | Tragic $54,580 |
| Jamaicans | 0.1 /100 | #266 | Tragic $54,560 |
| Guatemalans | 0.1 /100 | #267 | Tragic $54,526 |
| Immigrants | Zaire | 0.1 /100 | #268 | Tragic $54,512 |
| Nicaraguans | 0.1 /100 | #269 | Tragic $54,474 |
| Immigrants | Senegal | 0.1 /100 | #270 | Tragic $54,447 |
| Liberians | 0.1 /100 | #271 | Tragic $54,356 |
| Potawatomi | 0.1 /100 | #272 | Tragic $54,212 |
| Indonesians | 0.1 /100 | #273 | Tragic $54,176 |
| Barbadians | 0.1 /100 | #274 | Tragic $54,163 |
| Cherokee | 0.1 /100 | #275 | Tragic $54,133 |
| Cree | 0.1 /100 | #276 | Tragic $54,129 |
| Cheyenne | 0.1 /100 | #277 | Tragic $54,096 |
| Immigrants | Ecuador | 0.1 /100 | #278 | Tragic $54,030 |
| Blackfeet | 0.1 /100 | #279 | Tragic $54,029 |
| Immigrants | Jamaica | 0.1 /100 | #280 | Tragic $54,027 |
| Somalis | 0.1 /100 | #281 | Tragic $54,004 |
| Immigrants | Armenia | 0.1 /100 | #282 | Tragic $53,974 |
| Immigrants | Liberia | 0.1 /100 | #283 | Tragic $53,967 |
| Immigrants | Guatemala | 0.1 /100 | #284 | Tragic $53,950 |