Cherokee vs Indonesian Householder Income Over 65 years
COMPARE
Cherokee
Indonesian
Householder Income Over 65 years
Householder Income Over 65 years Comparison
Cherokee
Indonesians
$54,133
HOUSEHOLDER INCOME OVER 65 YEARS
0.1/ 100
METRIC RATING
275th/ 347
METRIC RANK
$54,176
HOUSEHOLDER INCOME OVER 65 YEARS
0.1/ 100
METRIC RATING
273rd/ 347
METRIC RANK
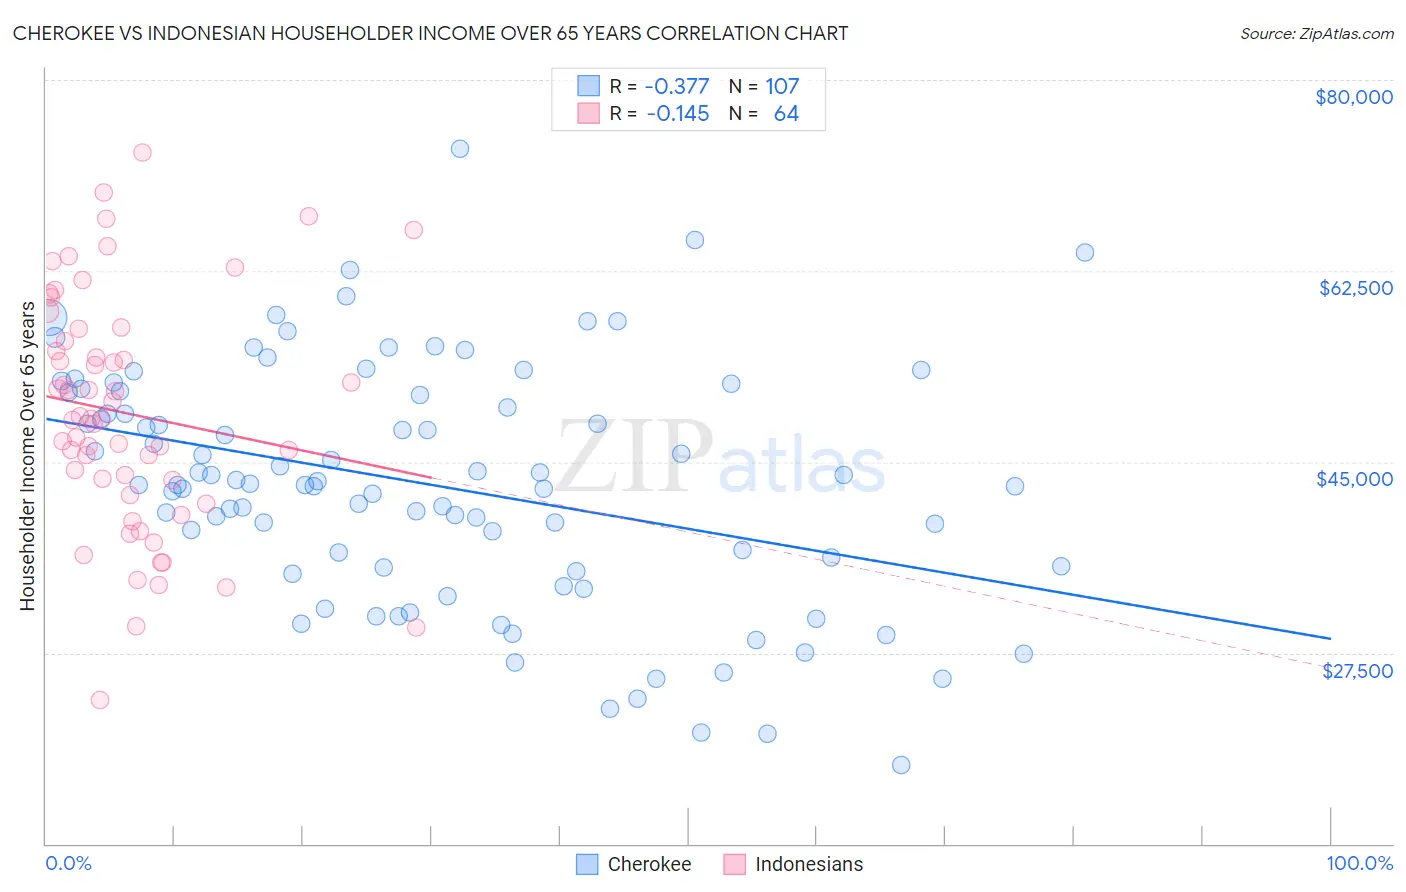
Cherokee vs Indonesian Householder Income Over 65 years Correlation Chart
The statistical analysis conducted on geographies consisting of 490,908,183 people shows a mild negative correlation between the proportion of Cherokee and household income with householder over the age of 65 in the United States with a correlation coefficient (R) of -0.377 and weighted average of $54,133. Similarly, the statistical analysis conducted on geographies consisting of 162,395,174 people shows a poor negative correlation between the proportion of Indonesians and household income with householder over the age of 65 in the United States with a correlation coefficient (R) of -0.145 and weighted average of $54,176, a difference of 0.080%.
Householder Income Over 65 years Correlation Summary
| Measurement | Cherokee | Indonesian |
| Minimum | $17,188 | $23,126 |
| Maximum | $73,750 | $73,361 |
| Range | $56,562 | $50,235 |
| Mean | $42,917 | $49,441 |
| Median | $42,899 | $48,888 |
| Interquartile 25% (IQ1) | $35,369 | $42,656 |
| Interquartile 75% (IQ3) | $51,355 | $56,577 |
| Interquartile Range (IQR) | $15,986 | $13,920 |
| Standard Deviation (Sample) | $10,957 | $10,775 |
| Standard Deviation (Population) | $10,906 | $10,690 |
Demographics Similar to Cherokee and Indonesians by Householder Income Over 65 years
In terms of householder income over 65 years, the demographic groups most similar to Cherokee are Cree ($54,129, a difference of 0.010%), Barbadian ($54,163, a difference of 0.060%), Cheyenne ($54,096, a difference of 0.070%), Potawatomi ($54,212, a difference of 0.15%), and Immigrants from Ecuador ($54,030, a difference of 0.19%). Similarly, the demographic groups most similar to Indonesians are Barbadian ($54,163, a difference of 0.020%), Potawatomi ($54,212, a difference of 0.070%), Cree ($54,129, a difference of 0.090%), Cheyenne ($54,096, a difference of 0.15%), and Immigrants from Ecuador ($54,030, a difference of 0.27%).
| Demographics | Rating | Rank | Householder Income Over 65 years |
| Apache | 0.1 /100 | #264 | Tragic $54,668 |
| Belizeans | 0.1 /100 | #265 | Tragic $54,580 |
| Jamaicans | 0.1 /100 | #266 | Tragic $54,560 |
| Guatemalans | 0.1 /100 | #267 | Tragic $54,526 |
| Immigrants | Zaire | 0.1 /100 | #268 | Tragic $54,512 |
| Nicaraguans | 0.1 /100 | #269 | Tragic $54,474 |
| Immigrants | Senegal | 0.1 /100 | #270 | Tragic $54,447 |
| Liberians | 0.1 /100 | #271 | Tragic $54,356 |
| Potawatomi | 0.1 /100 | #272 | Tragic $54,212 |
| Indonesians | 0.1 /100 | #273 | Tragic $54,176 |
| Barbadians | 0.1 /100 | #274 | Tragic $54,163 |
| Cherokee | 0.1 /100 | #275 | Tragic $54,133 |
| Cree | 0.1 /100 | #276 | Tragic $54,129 |
| Cheyenne | 0.1 /100 | #277 | Tragic $54,096 |
| Immigrants | Ecuador | 0.1 /100 | #278 | Tragic $54,030 |
| Blackfeet | 0.1 /100 | #279 | Tragic $54,029 |
| Immigrants | Jamaica | 0.1 /100 | #280 | Tragic $54,027 |
| Somalis | 0.1 /100 | #281 | Tragic $54,004 |
| Immigrants | Armenia | 0.1 /100 | #282 | Tragic $53,974 |
| Immigrants | Liberia | 0.1 /100 | #283 | Tragic $53,967 |
| Immigrants | Guatemala | 0.1 /100 | #284 | Tragic $53,950 |