Salvadoran vs Hungarian Householder Income Over 65 years
COMPARE
Salvadoran
Hungarian
Householder Income Over 65 years
Householder Income Over 65 years Comparison
Salvadorans
Hungarians
$59,141
HOUSEHOLDER INCOME OVER 65 YEARS
12.9/ 100
METRIC RATING
207th/ 347
METRIC RANK
$61,673
HOUSEHOLDER INCOME OVER 65 YEARS
67.7/ 100
METRIC RATING
151st/ 347
METRIC RANK
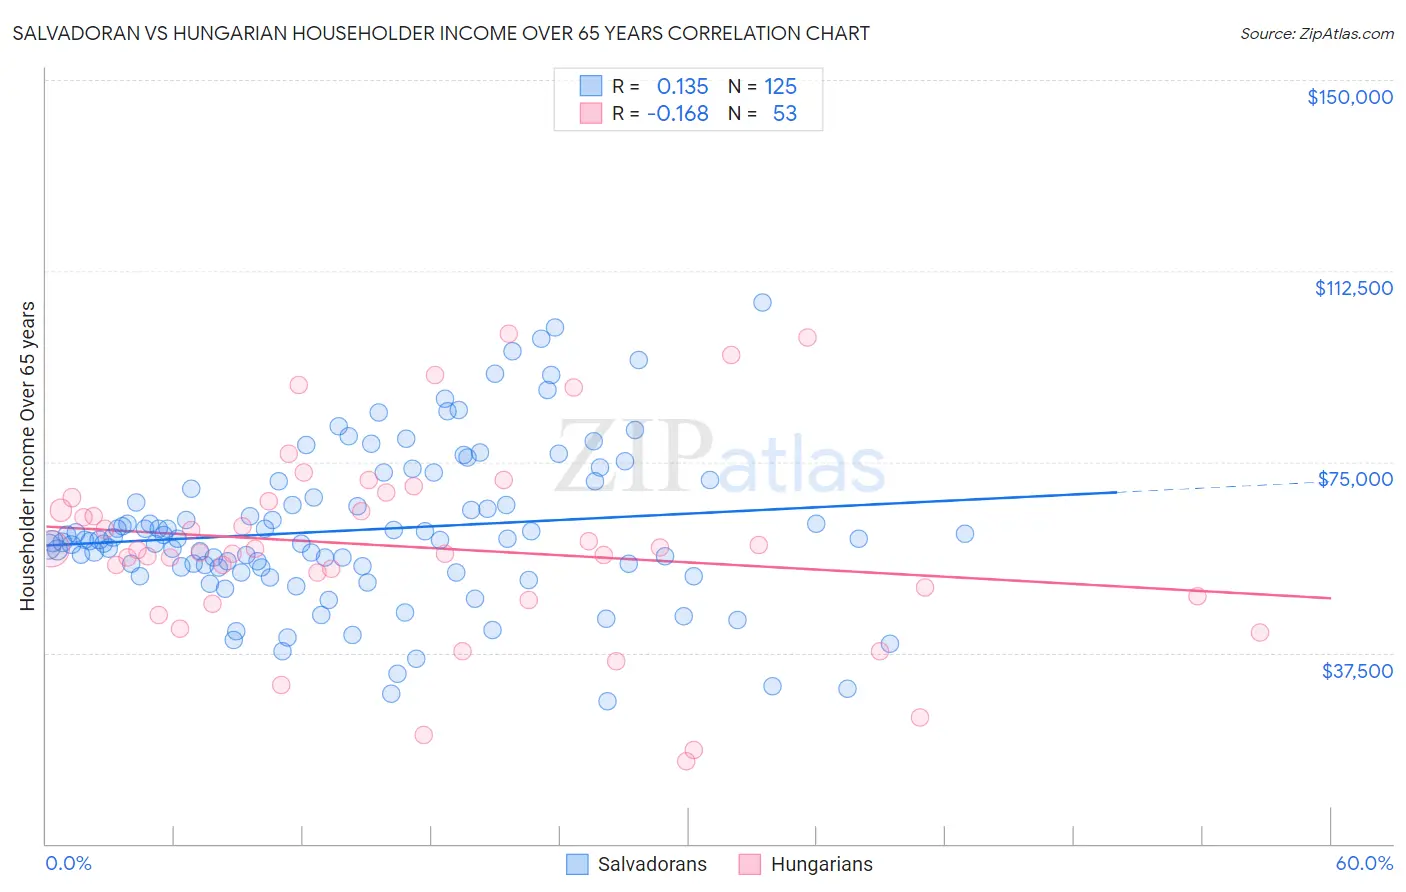
Salvadoran vs Hungarian Householder Income Over 65 years Correlation Chart
The statistical analysis conducted on geographies consisting of 397,216,988 people shows a poor positive correlation between the proportion of Salvadorans and household income with householder over the age of 65 in the United States with a correlation coefficient (R) of 0.135 and weighted average of $59,141. Similarly, the statistical analysis conducted on geographies consisting of 483,949,327 people shows a poor negative correlation between the proportion of Hungarians and household income with householder over the age of 65 in the United States with a correlation coefficient (R) of -0.168 and weighted average of $61,673, a difference of 4.3%.
Householder Income Over 65 years Correlation Summary
| Measurement | Salvadoran | Hungarian |
| Minimum | $28,014 | $16,250 |
| Maximum | $106,250 | $100,190 |
| Range | $78,236 | $83,940 |
| Mean | $61,666 | $58,276 |
| Median | $59,663 | $57,812 |
| Interquartile 25% (IQ1) | $54,245 | $48,254 |
| Interquartile 75% (IQ3) | $70,529 | $67,733 |
| Interquartile Range (IQR) | $16,284 | $19,479 |
| Standard Deviation (Sample) | $15,321 | $18,944 |
| Standard Deviation (Population) | $15,259 | $18,765 |
Similar Demographics by Householder Income Over 65 years
Demographics Similar to Salvadorans by Householder Income Over 65 years
In terms of householder income over 65 years, the demographic groups most similar to Salvadorans are Immigrants from South America ($59,151, a difference of 0.020%), Uruguayan ($59,090, a difference of 0.090%), Slovak ($59,039, a difference of 0.17%), Immigrants from Sudan ($59,248, a difference of 0.18%), and Nigerian ($58,992, a difference of 0.25%).
| Demographics | Rating | Rank | Householder Income Over 65 years |
| French | 20.2 /100 | #200 | Fair $59,656 |
| Dutch | 18.3 /100 | #201 | Poor $59,539 |
| Finns | 18.2 /100 | #202 | Poor $59,535 |
| Scotch-Irish | 16.9 /100 | #203 | Poor $59,447 |
| Arapaho | 16.0 /100 | #204 | Poor $59,383 |
| Immigrants | Sudan | 14.2 /100 | #205 | Poor $59,248 |
| Immigrants | South America | 13.0 /100 | #206 | Poor $59,151 |
| Salvadorans | 12.9 /100 | #207 | Poor $59,141 |
| Uruguayans | 12.3 /100 | #208 | Poor $59,090 |
| Slovaks | 11.7 /100 | #209 | Poor $59,039 |
| Nigerians | 11.2 /100 | #210 | Poor $58,992 |
| Immigrants | Nigeria | 10.7 /100 | #211 | Poor $58,942 |
| Colombians | 9.8 /100 | #212 | Tragic $58,851 |
| Whites/Caucasians | 9.8 /100 | #213 | Tragic $58,847 |
| Nepalese | 9.0 /100 | #214 | Tragic $58,761 |
Demographics Similar to Hungarians by Householder Income Over 65 years
In terms of householder income over 65 years, the demographic groups most similar to Hungarians are Armenian ($61,656, a difference of 0.030%), Slavic ($61,709, a difference of 0.060%), Costa Rican ($61,638, a difference of 0.060%), Swiss ($61,621, a difference of 0.080%), and Scottish ($61,735, a difference of 0.10%).
| Demographics | Rating | Rank | Householder Income Over 65 years |
| Immigrants | Peru | 74.4 /100 | #144 | Good $61,988 |
| Immigrants | Uganda | 74.2 /100 | #145 | Good $61,976 |
| Immigrants | Southern Europe | 72.7 /100 | #146 | Good $61,902 |
| Immigrants | Nepal | 71.4 /100 | #147 | Good $61,843 |
| Alsatians | 70.5 /100 | #148 | Good $61,797 |
| Scottish | 69.1 /100 | #149 | Good $61,735 |
| Slavs | 68.5 /100 | #150 | Good $61,709 |
| Hungarians | 67.7 /100 | #151 | Good $61,673 |
| Armenians | 67.3 /100 | #152 | Good $61,656 |
| Costa Ricans | 66.9 /100 | #153 | Good $61,638 |
| Swiss | 66.5 /100 | #154 | Good $61,621 |
| Poles | 65.9 /100 | #155 | Good $61,598 |
| Scandinavians | 65.6 /100 | #156 | Good $61,586 |
| Macedonians | 65.1 /100 | #157 | Good $61,564 |
| English | 63.3 /100 | #158 | Good $61,487 |