Filipino vs Hungarian Householder Income Over 65 years
COMPARE
Filipino
Hungarian
Householder Income Over 65 years
Householder Income Over 65 years Comparison
Filipinos
Hungarians
$76,686
HOUSEHOLDER INCOME OVER 65 YEARS
100.0/ 100
METRIC RATING
4th/ 347
METRIC RANK
$61,673
HOUSEHOLDER INCOME OVER 65 YEARS
67.7/ 100
METRIC RATING
151st/ 347
METRIC RANK
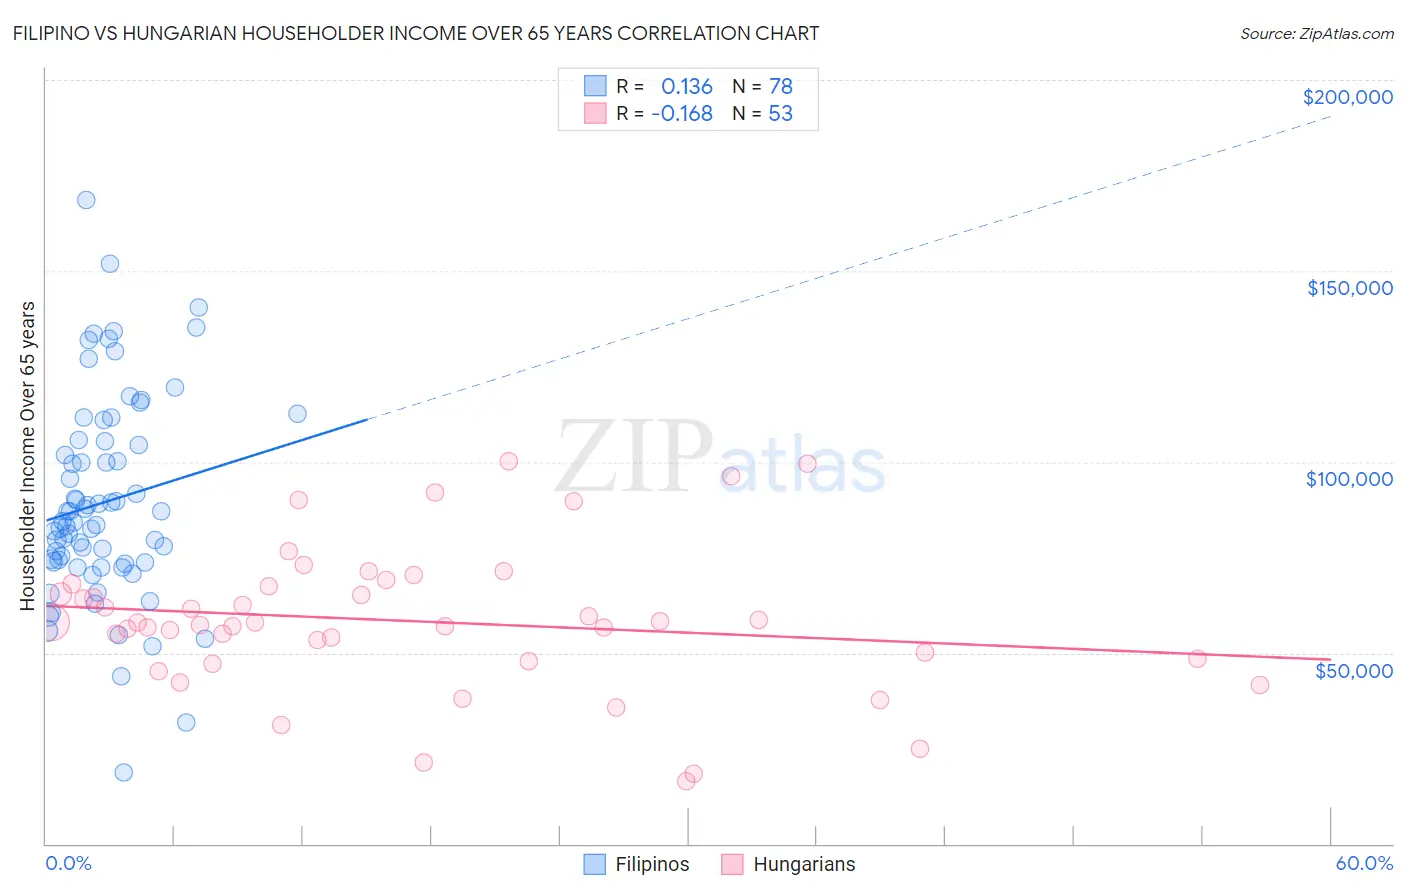
Filipino vs Hungarian Householder Income Over 65 years Correlation Chart
The statistical analysis conducted on geographies consisting of 253,664,228 people shows a poor positive correlation between the proportion of Filipinos and household income with householder over the age of 65 in the United States with a correlation coefficient (R) of 0.136 and weighted average of $76,686. Similarly, the statistical analysis conducted on geographies consisting of 483,949,327 people shows a poor negative correlation between the proportion of Hungarians and household income with householder over the age of 65 in the United States with a correlation coefficient (R) of -0.168 and weighted average of $61,673, a difference of 24.3%.
Householder Income Over 65 years Correlation Summary
| Measurement | Filipino | Hungarian |
| Minimum | $18,667 | $16,250 |
| Maximum | $168,449 | $100,190 |
| Range | $149,782 | $83,940 |
| Mean | $89,373 | $58,276 |
| Median | $84,207 | $57,812 |
| Interquartile 25% (IQ1) | $73,750 | $48,254 |
| Interquartile 75% (IQ3) | $105,277 | $67,733 |
| Interquartile Range (IQR) | $31,527 | $19,479 |
| Standard Deviation (Sample) | $26,949 | $18,944 |
| Standard Deviation (Population) | $26,776 | $18,765 |
Similar Demographics by Householder Income Over 65 years
Demographics Similar to Filipinos by Householder Income Over 65 years
In terms of householder income over 65 years, the demographic groups most similar to Filipinos are Immigrants from Taiwan ($77,051, a difference of 0.48%), Iranian ($77,429, a difference of 0.97%), Chinese ($77,465, a difference of 1.0%), Immigrants from Iran ($75,081, a difference of 2.1%), and Bolivian ($74,245, a difference of 3.3%).
| Demographics | Rating | Rank | Householder Income Over 65 years |
| Chinese | 100.0 /100 | #1 | Exceptional $77,465 |
| Iranians | 100.0 /100 | #2 | Exceptional $77,429 |
| Immigrants | Taiwan | 100.0 /100 | #3 | Exceptional $77,051 |
| Filipinos | 100.0 /100 | #4 | Exceptional $76,686 |
| Immigrants | Iran | 100.0 /100 | #5 | Exceptional $75,081 |
| Bolivians | 100.0 /100 | #6 | Exceptional $74,245 |
| Immigrants | Bolivia | 100.0 /100 | #7 | Exceptional $73,434 |
| Immigrants | Singapore | 100.0 /100 | #8 | Exceptional $72,963 |
| Immigrants | India | 100.0 /100 | #9 | Exceptional $72,804 |
| Bhutanese | 100.0 /100 | #10 | Exceptional $72,288 |
| Thais | 100.0 /100 | #11 | Exceptional $72,099 |
| Cypriots | 100.0 /100 | #12 | Exceptional $71,714 |
| Immigrants | Hong Kong | 100.0 /100 | #13 | Exceptional $71,567 |
| Burmese | 100.0 /100 | #14 | Exceptional $71,139 |
| Native Hawaiians | 100.0 /100 | #15 | Exceptional $71,021 |
Demographics Similar to Hungarians by Householder Income Over 65 years
In terms of householder income over 65 years, the demographic groups most similar to Hungarians are Armenian ($61,656, a difference of 0.030%), Slavic ($61,709, a difference of 0.060%), Costa Rican ($61,638, a difference of 0.060%), Swiss ($61,621, a difference of 0.080%), and Scottish ($61,735, a difference of 0.10%).
| Demographics | Rating | Rank | Householder Income Over 65 years |
| Immigrants | Peru | 74.4 /100 | #144 | Good $61,988 |
| Immigrants | Uganda | 74.2 /100 | #145 | Good $61,976 |
| Immigrants | Southern Europe | 72.7 /100 | #146 | Good $61,902 |
| Immigrants | Nepal | 71.4 /100 | #147 | Good $61,843 |
| Alsatians | 70.5 /100 | #148 | Good $61,797 |
| Scottish | 69.1 /100 | #149 | Good $61,735 |
| Slavs | 68.5 /100 | #150 | Good $61,709 |
| Hungarians | 67.7 /100 | #151 | Good $61,673 |
| Armenians | 67.3 /100 | #152 | Good $61,656 |
| Costa Ricans | 66.9 /100 | #153 | Good $61,638 |
| Swiss | 66.5 /100 | #154 | Good $61,621 |
| Poles | 65.9 /100 | #155 | Good $61,598 |
| Scandinavians | 65.6 /100 | #156 | Good $61,586 |
| Macedonians | 65.1 /100 | #157 | Good $61,564 |
| English | 63.3 /100 | #158 | Good $61,487 |