Inupiat vs Hungarian Householder Income Over 65 years
COMPARE
Inupiat
Hungarian
Householder Income Over 65 years
Householder Income Over 65 years Comparison
Inupiat
Hungarians
$61,061
HOUSEHOLDER INCOME OVER 65 YEARS
52.4/ 100
METRIC RATING
171st/ 347
METRIC RANK
$61,673
HOUSEHOLDER INCOME OVER 65 YEARS
67.7/ 100
METRIC RATING
151st/ 347
METRIC RANK
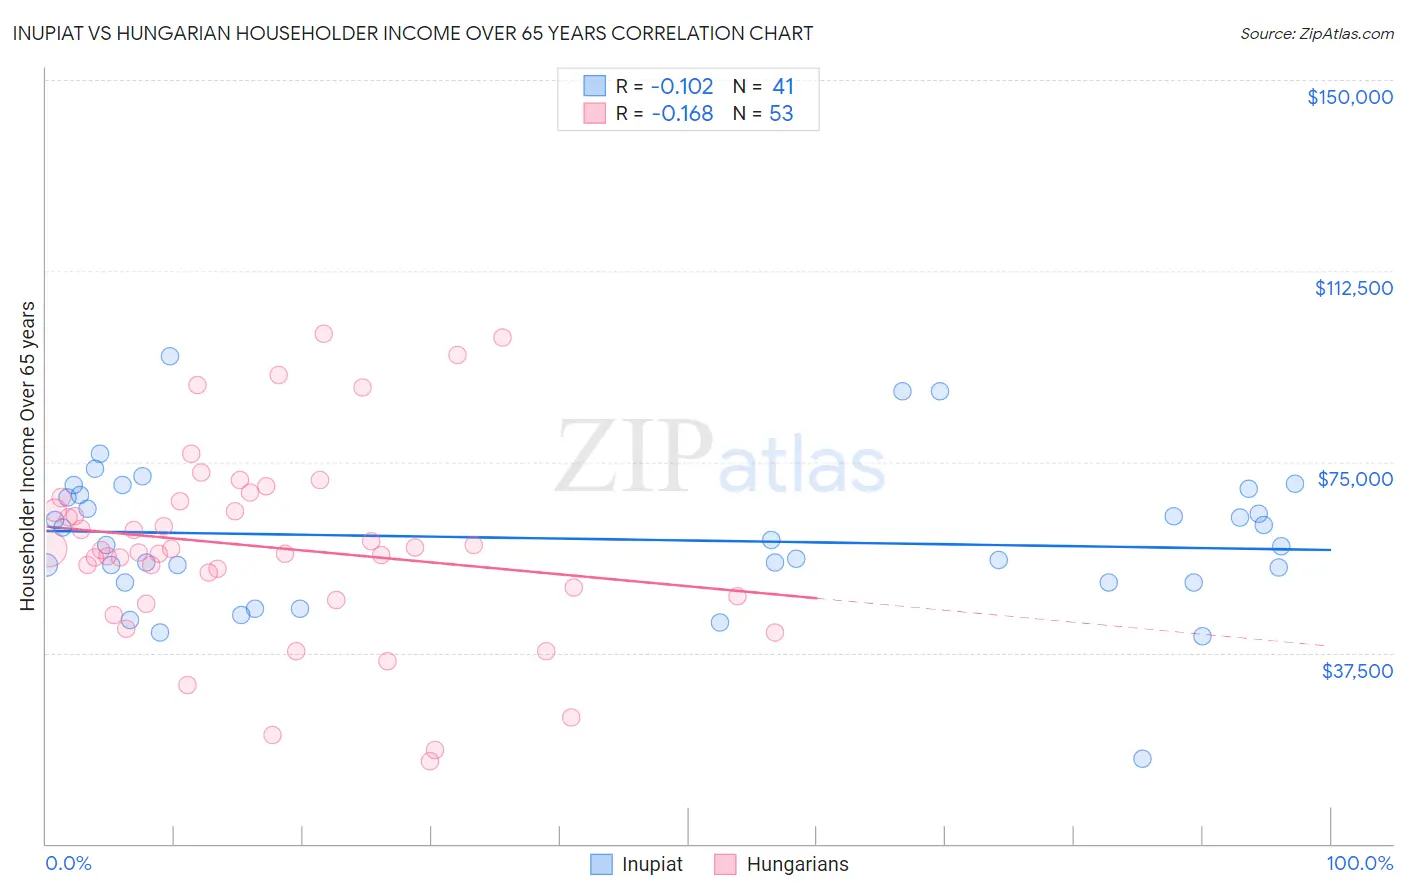
Inupiat vs Hungarian Householder Income Over 65 years Correlation Chart
The statistical analysis conducted on geographies consisting of 96,206,206 people shows a poor negative correlation between the proportion of Inupiat and household income with householder over the age of 65 in the United States with a correlation coefficient (R) of -0.102 and weighted average of $61,061. Similarly, the statistical analysis conducted on geographies consisting of 483,949,327 people shows a poor negative correlation between the proportion of Hungarians and household income with householder over the age of 65 in the United States with a correlation coefficient (R) of -0.168 and weighted average of $61,673, a difference of 1.0%.
Householder Income Over 65 years Correlation Summary
| Measurement | Inupiat | Hungarian |
| Minimum | $16,607 | $16,250 |
| Maximum | $95,647 | $100,190 |
| Range | $79,040 | $83,940 |
| Mean | $59,905 | $58,276 |
| Median | $58,687 | $57,812 |
| Interquartile 25% (IQ1) | $51,307 | $48,254 |
| Interquartile 75% (IQ3) | $69,101 | $67,733 |
| Interquartile Range (IQR) | $17,794 | $19,479 |
| Standard Deviation (Sample) | $14,461 | $18,944 |
| Standard Deviation (Population) | $14,284 | $18,765 |
Demographics Similar to Inupiat and Hungarians by Householder Income Over 65 years
In terms of householder income over 65 years, the demographic groups most similar to Inupiat are Serbian ($61,087, a difference of 0.040%), Carpatho Rusyn ($61,093, a difference of 0.050%), Irish ($61,097, a difference of 0.060%), Norwegian ($61,104, a difference of 0.070%), and Immigrants from Eastern Africa ($61,157, a difference of 0.16%). Similarly, the demographic groups most similar to Hungarians are Armenian ($61,656, a difference of 0.030%), Costa Rican ($61,638, a difference of 0.060%), Swiss ($61,621, a difference of 0.080%), Polish ($61,598, a difference of 0.12%), and Scandinavian ($61,586, a difference of 0.14%).
| Demographics | Rating | Rank | Householder Income Over 65 years |
| Hungarians | 67.7 /100 | #151 | Good $61,673 |
| Armenians | 67.3 /100 | #152 | Good $61,656 |
| Costa Ricans | 66.9 /100 | #153 | Good $61,638 |
| Swiss | 66.5 /100 | #154 | Good $61,621 |
| Poles | 65.9 /100 | #155 | Good $61,598 |
| Scandinavians | 65.6 /100 | #156 | Good $61,586 |
| Macedonians | 65.1 /100 | #157 | Good $61,564 |
| English | 63.3 /100 | #158 | Good $61,487 |
| Brazilians | 62.7 /100 | #159 | Good $61,465 |
| Portuguese | 62.1 /100 | #160 | Good $61,440 |
| Icelanders | 57.9 /100 | #161 | Average $61,270 |
| Czechs | 57.2 /100 | #162 | Average $61,244 |
| Ugandans | 55.5 /100 | #163 | Average $61,177 |
| Immigrants | North Macedonia | 55.4 /100 | #164 | Average $61,175 |
| Immigrants | Ukraine | 55.1 /100 | #165 | Average $61,163 |
| Immigrants | Eastern Africa | 55.0 /100 | #166 | Average $61,157 |
| Norwegians | 53.6 /100 | #167 | Average $61,104 |
| Irish | 53.4 /100 | #168 | Average $61,097 |
| Carpatho Rusyns | 53.3 /100 | #169 | Average $61,093 |
| Serbians | 53.1 /100 | #170 | Average $61,087 |
| Inupiat | 52.4 /100 | #171 | Average $61,061 |