Central American vs Immigrants from Middle Africa Per Capita Income
COMPARE
Central American
Immigrants from Middle Africa
Per Capita Income
Per Capita Income Comparison
Central Americans
Immigrants from Middle Africa
$38,560
PER CAPITA INCOME
0.3/ 100
METRIC RATING
271st/ 347
METRIC RANK
$39,529
PER CAPITA INCOME
1.0/ 100
METRIC RATING
255th/ 347
METRIC RANK
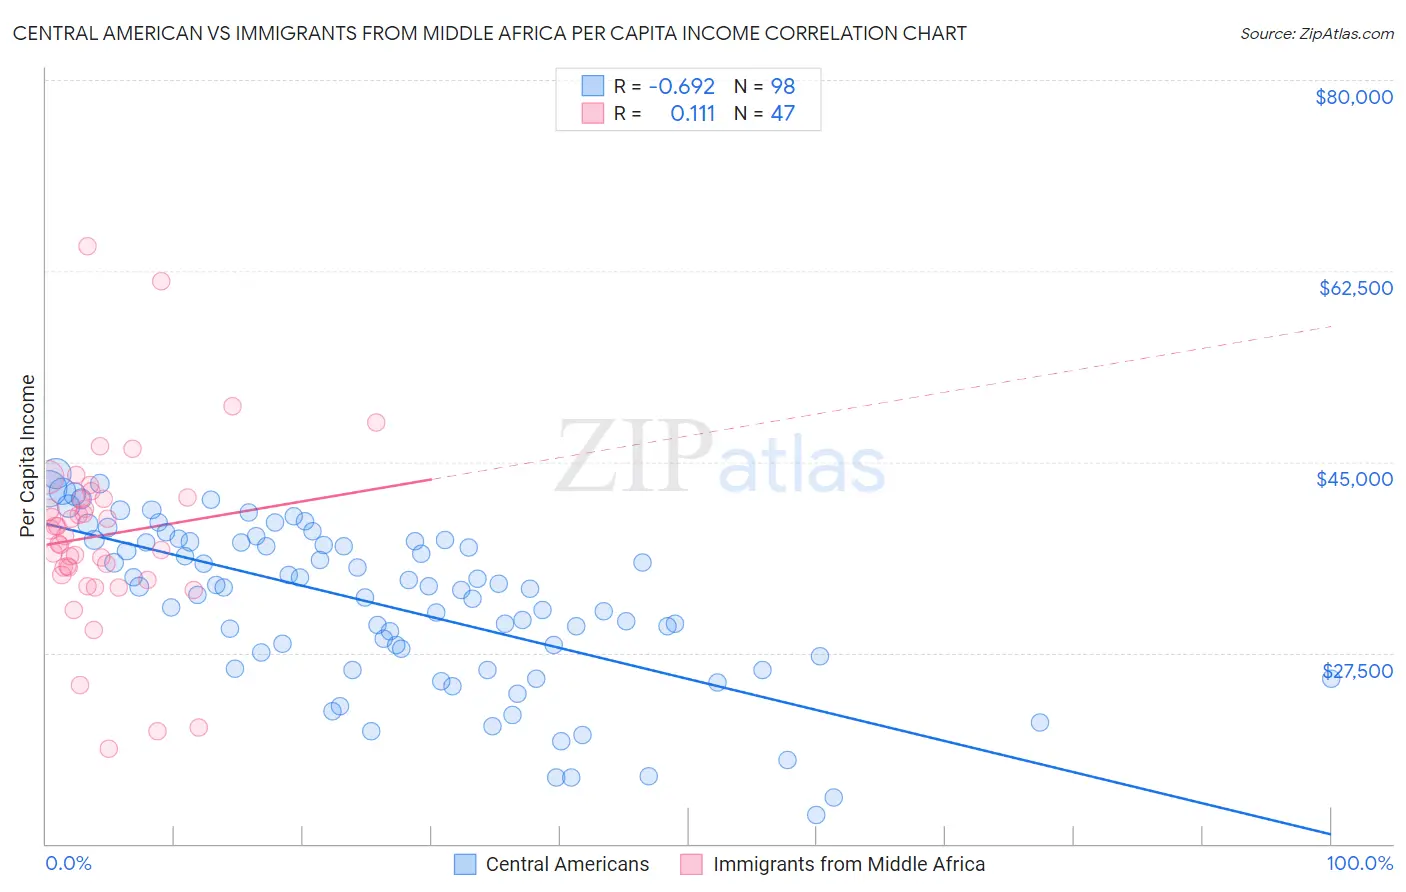
Central American vs Immigrants from Middle Africa Per Capita Income Correlation Chart
The statistical analysis conducted on geographies consisting of 504,669,146 people shows a significant negative correlation between the proportion of Central Americans and per capita income in the United States with a correlation coefficient (R) of -0.692 and weighted average of $38,560. Similarly, the statistical analysis conducted on geographies consisting of 202,748,114 people shows a poor positive correlation between the proportion of Immigrants from Middle Africa and per capita income in the United States with a correlation coefficient (R) of 0.111 and weighted average of $39,529, a difference of 2.5%.
Per Capita Income Correlation Summary
| Measurement | Central American | Immigrants from Middle Africa |
| Minimum | $12,606 | $18,741 |
| Maximum | $43,950 | $64,792 |
| Range | $31,344 | $46,051 |
| Mean | $31,868 | $38,268 |
| Median | $33,444 | $38,152 |
| Interquartile 25% (IQ1) | $27,188 | $34,623 |
| Interquartile 75% (IQ3) | $37,671 | $41,622 |
| Interquartile Range (IQR) | $10,483 | $6,999 |
| Standard Deviation (Sample) | $7,379 | $8,450 |
| Standard Deviation (Population) | $7,341 | $8,360 |
Demographics Similar to Central Americans and Immigrants from Middle Africa by Per Capita Income
In terms of per capita income, the demographic groups most similar to Central Americans are Immigrants from Cabo Verde ($38,540, a difference of 0.050%), Immigrants from Belize ($38,614, a difference of 0.14%), Nepalese ($38,442, a difference of 0.31%), Immigrants from Jamaica ($38,766, a difference of 0.53%), and Liberian ($38,780, a difference of 0.57%). Similarly, the demographic groups most similar to Immigrants from Middle Africa are Alaska Native ($39,558, a difference of 0.070%), Osage ($39,568, a difference of 0.10%), Hawaiian ($39,403, a difference of 0.32%), Nicaraguan ($39,372, a difference of 0.40%), and Jamaican ($39,231, a difference of 0.76%).
| Demographics | Rating | Rank | Per Capita Income |
| Osage | 1.0 /100 | #253 | Tragic $39,568 |
| Alaska Natives | 1.0 /100 | #254 | Tragic $39,558 |
| Immigrants | Middle Africa | 1.0 /100 | #255 | Tragic $39,529 |
| Hawaiians | 0.8 /100 | #256 | Tragic $39,403 |
| Nicaraguans | 0.8 /100 | #257 | Tragic $39,372 |
| Jamaicans | 0.7 /100 | #258 | Tragic $39,231 |
| Malaysians | 0.7 /100 | #259 | Tragic $39,194 |
| Alaskan Athabascans | 0.6 /100 | #260 | Tragic $39,163 |
| Marshallese | 0.6 /100 | #261 | Tragic $39,108 |
| Iroquois | 0.6 /100 | #262 | Tragic $39,104 |
| Belizeans | 0.6 /100 | #263 | Tragic $39,097 |
| Americans | 0.6 /100 | #264 | Tragic $39,039 |
| Spanish Americans | 0.5 /100 | #265 | Tragic $39,012 |
| Salvadorans | 0.5 /100 | #266 | Tragic $38,858 |
| Immigrants | Zaire | 0.4 /100 | #267 | Tragic $38,848 |
| Liberians | 0.4 /100 | #268 | Tragic $38,780 |
| Immigrants | Jamaica | 0.4 /100 | #269 | Tragic $38,766 |
| Immigrants | Belize | 0.3 /100 | #270 | Tragic $38,614 |
| Central Americans | 0.3 /100 | #271 | Tragic $38,560 |
| Immigrants | Cabo Verde | 0.3 /100 | #272 | Tragic $38,540 |
| Nepalese | 0.3 /100 | #273 | Tragic $38,442 |