Central American vs Greek Per Capita Income
COMPARE
Central American
Greek
Per Capita Income
Per Capita Income Comparison
Central Americans
Greeks
$38,560
PER CAPITA INCOME
0.3/ 100
METRIC RATING
271st/ 347
METRIC RANK
$49,309
PER CAPITA INCOME
99.8/ 100
METRIC RATING
71st/ 347
METRIC RANK
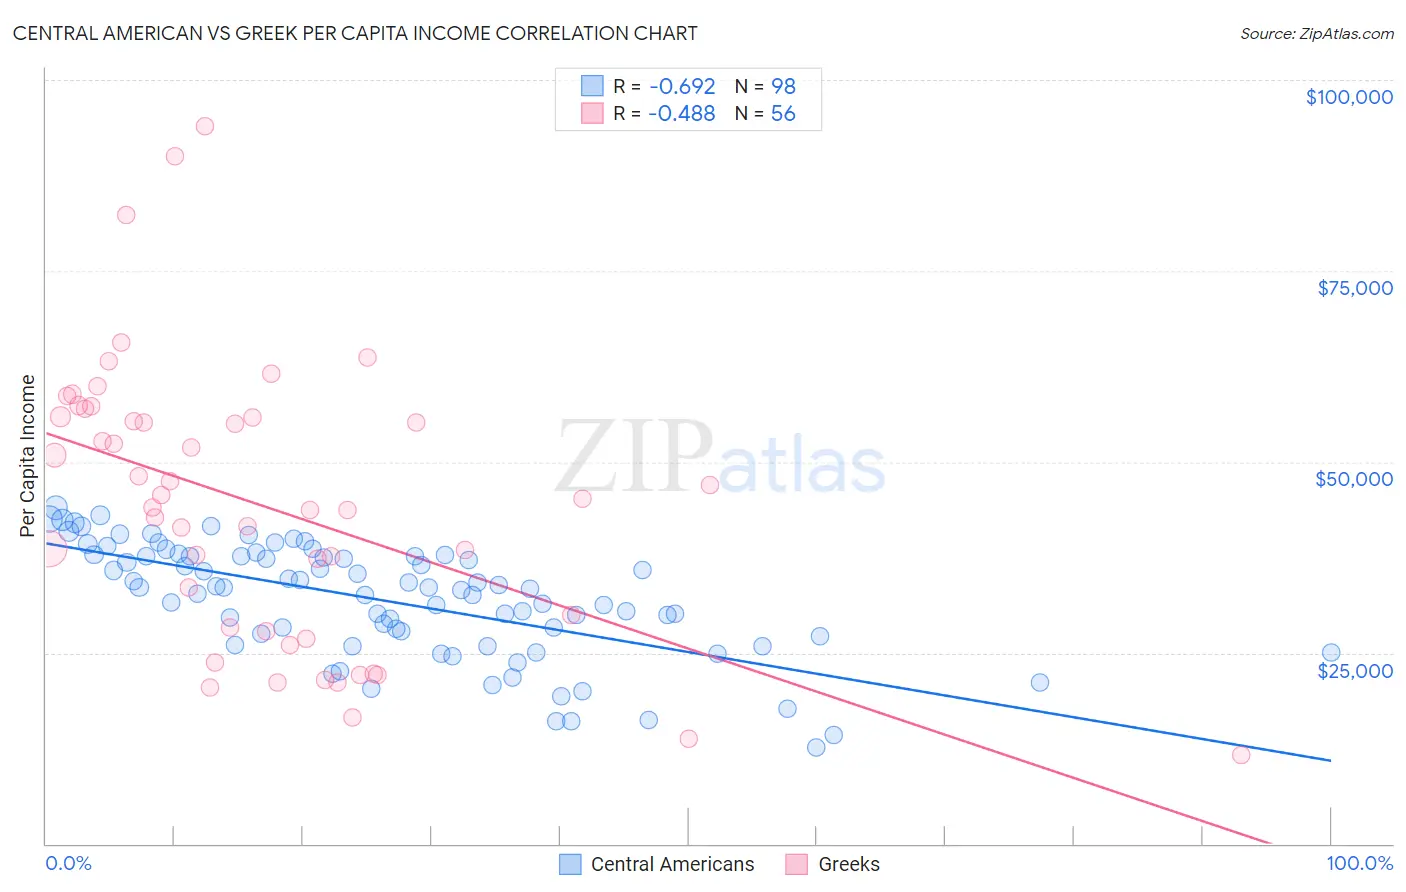
Central American vs Greek Per Capita Income Correlation Chart
The statistical analysis conducted on geographies consisting of 504,669,146 people shows a significant negative correlation between the proportion of Central Americans and per capita income in the United States with a correlation coefficient (R) of -0.692 and weighted average of $38,560. Similarly, the statistical analysis conducted on geographies consisting of 482,808,471 people shows a moderate negative correlation between the proportion of Greeks and per capita income in the United States with a correlation coefficient (R) of -0.488 and weighted average of $49,309, a difference of 27.9%.
Per Capita Income Correlation Summary
| Measurement | Central American | Greek |
| Minimum | $12,606 | $11,668 |
| Maximum | $43,950 | $93,958 |
| Range | $31,344 | $82,290 |
| Mean | $31,868 | $44,253 |
| Median | $33,444 | $44,552 |
| Interquartile 25% (IQ1) | $27,188 | $28,035 |
| Interquartile 75% (IQ3) | $37,671 | $55,859 |
| Interquartile Range (IQR) | $10,483 | $27,823 |
| Standard Deviation (Sample) | $7,379 | $18,189 |
| Standard Deviation (Population) | $7,341 | $18,026 |
Similar Demographics by Per Capita Income
Demographics Similar to Central Americans by Per Capita Income
In terms of per capita income, the demographic groups most similar to Central Americans are Immigrants from Cabo Verde ($38,540, a difference of 0.050%), Immigrants from Belize ($38,614, a difference of 0.14%), Nepalese ($38,442, a difference of 0.31%), Immigrants from El Salvador ($38,394, a difference of 0.43%), and Immigrants from Jamaica ($38,766, a difference of 0.53%).
| Demographics | Rating | Rank | Per Capita Income |
| Americans | 0.6 /100 | #264 | Tragic $39,039 |
| Spanish Americans | 0.5 /100 | #265 | Tragic $39,012 |
| Salvadorans | 0.5 /100 | #266 | Tragic $38,858 |
| Immigrants | Zaire | 0.4 /100 | #267 | Tragic $38,848 |
| Liberians | 0.4 /100 | #268 | Tragic $38,780 |
| Immigrants | Jamaica | 0.4 /100 | #269 | Tragic $38,766 |
| Immigrants | Belize | 0.3 /100 | #270 | Tragic $38,614 |
| Central Americans | 0.3 /100 | #271 | Tragic $38,560 |
| Immigrants | Cabo Verde | 0.3 /100 | #272 | Tragic $38,540 |
| Nepalese | 0.3 /100 | #273 | Tragic $38,442 |
| Immigrants | El Salvador | 0.3 /100 | #274 | Tragic $38,394 |
| Immigrants | Liberia | 0.2 /100 | #275 | Tragic $38,165 |
| Hmong | 0.2 /100 | #276 | Tragic $38,120 |
| Comanche | 0.2 /100 | #277 | Tragic $38,088 |
| Immigrants | Nicaragua | 0.2 /100 | #278 | Tragic $38,065 |
Demographics Similar to Greeks by Per Capita Income
In terms of per capita income, the demographic groups most similar to Greeks are Immigrants from Eastern Europe ($49,316, a difference of 0.010%), Immigrants from Hungary ($49,303, a difference of 0.010%), Immigrants from North America ($49,302, a difference of 0.010%), Immigrants from Canada ($49,412, a difference of 0.21%), and Lithuanian ($49,448, a difference of 0.28%).
| Demographics | Rating | Rank | Per Capita Income |
| Immigrants | Argentina | 99.9 /100 | #64 | Exceptional $49,627 |
| Bolivians | 99.9 /100 | #65 | Exceptional $49,526 |
| Immigrants | Bulgaria | 99.9 /100 | #66 | Exceptional $49,482 |
| Immigrants | Romania | 99.9 /100 | #67 | Exceptional $49,463 |
| Lithuanians | 99.8 /100 | #68 | Exceptional $49,448 |
| Immigrants | Canada | 99.8 /100 | #69 | Exceptional $49,412 |
| Immigrants | Eastern Europe | 99.8 /100 | #70 | Exceptional $49,316 |
| Greeks | 99.8 /100 | #71 | Exceptional $49,309 |
| Immigrants | Hungary | 99.8 /100 | #72 | Exceptional $49,303 |
| Immigrants | North America | 99.8 /100 | #73 | Exceptional $49,302 |
| Mongolians | 99.8 /100 | #74 | Exceptional $49,173 |
| Immigrants | Bolivia | 99.7 /100 | #75 | Exceptional $48,970 |
| Immigrants | England | 99.7 /100 | #76 | Exceptional $48,844 |
| Immigrants | Kazakhstan | 99.7 /100 | #77 | Exceptional $48,747 |
| Immigrants | Italy | 99.6 /100 | #78 | Exceptional $48,654 |