Immigrants from Dominica vs Tongan Median Earnings
COMPARE
Immigrants from Dominica
Tongan
Median Earnings
Median Earnings Comparison
Immigrants from Dominica
Tongans
$42,420
MEDIAN EARNINGS
0.4/ 100
METRIC RATING
273rd/ 347
METRIC RANK
$45,665
MEDIAN EARNINGS
25.4/ 100
METRIC RATING
205th/ 347
METRIC RANK
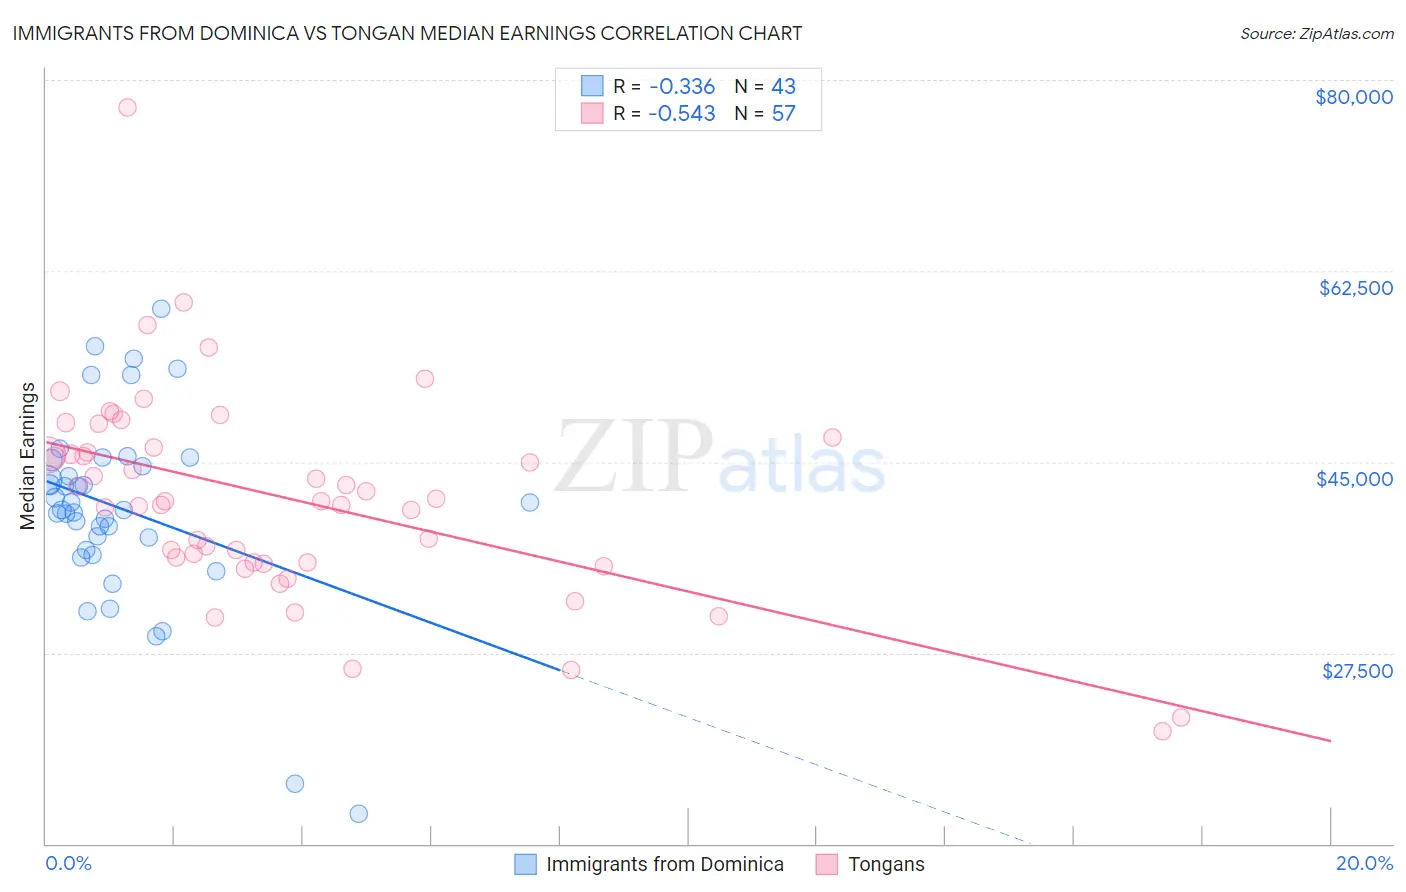
Immigrants from Dominica vs Tongan Median Earnings Correlation Chart
The statistical analysis conducted on geographies consisting of 83,794,141 people shows a mild negative correlation between the proportion of Immigrants from Dominica and median earnings in the United States with a correlation coefficient (R) of -0.336 and weighted average of $42,420. Similarly, the statistical analysis conducted on geographies consisting of 102,906,626 people shows a substantial negative correlation between the proportion of Tongans and median earnings in the United States with a correlation coefficient (R) of -0.543 and weighted average of $45,665, a difference of 7.6%.
Median Earnings Correlation Summary
| Measurement | Immigrants from Dominica | Tongan |
| Minimum | $12,717 | $20,292 |
| Maximum | $59,056 | $77,441 |
| Range | $46,339 | $57,149 |
| Mean | $40,644 | $41,730 |
| Median | $40,628 | $41,421 |
| Interquartile 25% (IQ1) | $36,948 | $35,786 |
| Interquartile 75% (IQ3) | $45,188 | $46,789 |
| Interquartile Range (IQR) | $8,240 | $11,003 |
| Standard Deviation (Sample) | $8,982 | $9,523 |
| Standard Deviation (Population) | $8,876 | $9,439 |
Similar Demographics by Median Earnings
Demographics Similar to Immigrants from Dominica by Median Earnings
In terms of median earnings, the demographic groups most similar to Immigrants from Dominica are Immigrants from El Salvador ($42,413, a difference of 0.020%), Iroquois ($42,430, a difference of 0.030%), Immigrants from Belize ($42,339, a difference of 0.19%), Spanish American ($42,316, a difference of 0.25%), and Central American ($42,280, a difference of 0.33%).
| Demographics | Rating | Rank | Median Earnings |
| Immigrants | Laos | 0.7 /100 | #266 | Tragic $42,884 |
| Cree | 0.6 /100 | #267 | Tragic $42,777 |
| Americans | 0.6 /100 | #268 | Tragic $42,742 |
| Belizeans | 0.5 /100 | #269 | Tragic $42,702 |
| Osage | 0.5 /100 | #270 | Tragic $42,651 |
| Pennsylvania Germans | 0.5 /100 | #271 | Tragic $42,615 |
| Iroquois | 0.4 /100 | #272 | Tragic $42,430 |
| Immigrants | Dominica | 0.4 /100 | #273 | Tragic $42,420 |
| Immigrants | El Salvador | 0.4 /100 | #274 | Tragic $42,413 |
| Immigrants | Belize | 0.3 /100 | #275 | Tragic $42,339 |
| Spanish Americans | 0.3 /100 | #276 | Tragic $42,316 |
| Central Americans | 0.3 /100 | #277 | Tragic $42,280 |
| Cajuns | 0.3 /100 | #278 | Tragic $42,189 |
| Colville | 0.2 /100 | #279 | Tragic $42,151 |
| Hmong | 0.2 /100 | #280 | Tragic $42,111 |
Demographics Similar to Tongans by Median Earnings
In terms of median earnings, the demographic groups most similar to Tongans are Immigrants from Uruguay ($45,682, a difference of 0.040%), Immigrants from Ghana ($45,641, a difference of 0.050%), Welsh ($45,710, a difference of 0.10%), Immigrants from Senegal ($45,611, a difference of 0.12%), and Immigrants from Trinidad and Tobago ($45,729, a difference of 0.14%).
| Demographics | Rating | Rank | Median Earnings |
| Trinidadians and Tobagonians | 29.7 /100 | #198 | Fair $45,820 |
| Immigrants | Barbados | 29.6 /100 | #199 | Fair $45,816 |
| Immigrants | Azores | 29.5 /100 | #200 | Fair $45,812 |
| Celtics | 27.2 /100 | #201 | Fair $45,732 |
| Immigrants | Trinidad and Tobago | 27.1 /100 | #202 | Fair $45,729 |
| Welsh | 26.6 /100 | #203 | Fair $45,710 |
| Immigrants | Uruguay | 25.9 /100 | #204 | Fair $45,682 |
| Tongans | 25.4 /100 | #205 | Fair $45,665 |
| Immigrants | Ghana | 24.8 /100 | #206 | Fair $45,641 |
| Immigrants | Senegal | 24.0 /100 | #207 | Fair $45,611 |
| Immigrants | Bosnia and Herzegovina | 23.7 /100 | #208 | Fair $45,600 |
| Immigrants | Thailand | 23.7 /100 | #209 | Fair $45,598 |
| Immigrants | Grenada | 23.6 /100 | #210 | Fair $45,596 |
| Panamanians | 23.5 /100 | #211 | Fair $45,593 |
| Bermudans | 23.5 /100 | #212 | Fair $45,593 |