Immigrants from Trinidad and Tobago vs Nonimmigrants Median Earnings
COMPARE
Immigrants from Trinidad and Tobago
Nonimmigrants
Median Earnings
Median Earnings Comparison
Immigrants from Trinidad and Tobago
Nonimmigrants
$45,729
MEDIAN EARNINGS
27.1/ 100
METRIC RATING
202nd/ 347
METRIC RANK
$44,117
MEDIAN EARNINGS
3.7/ 100
METRIC RATING
244th/ 347
METRIC RANK
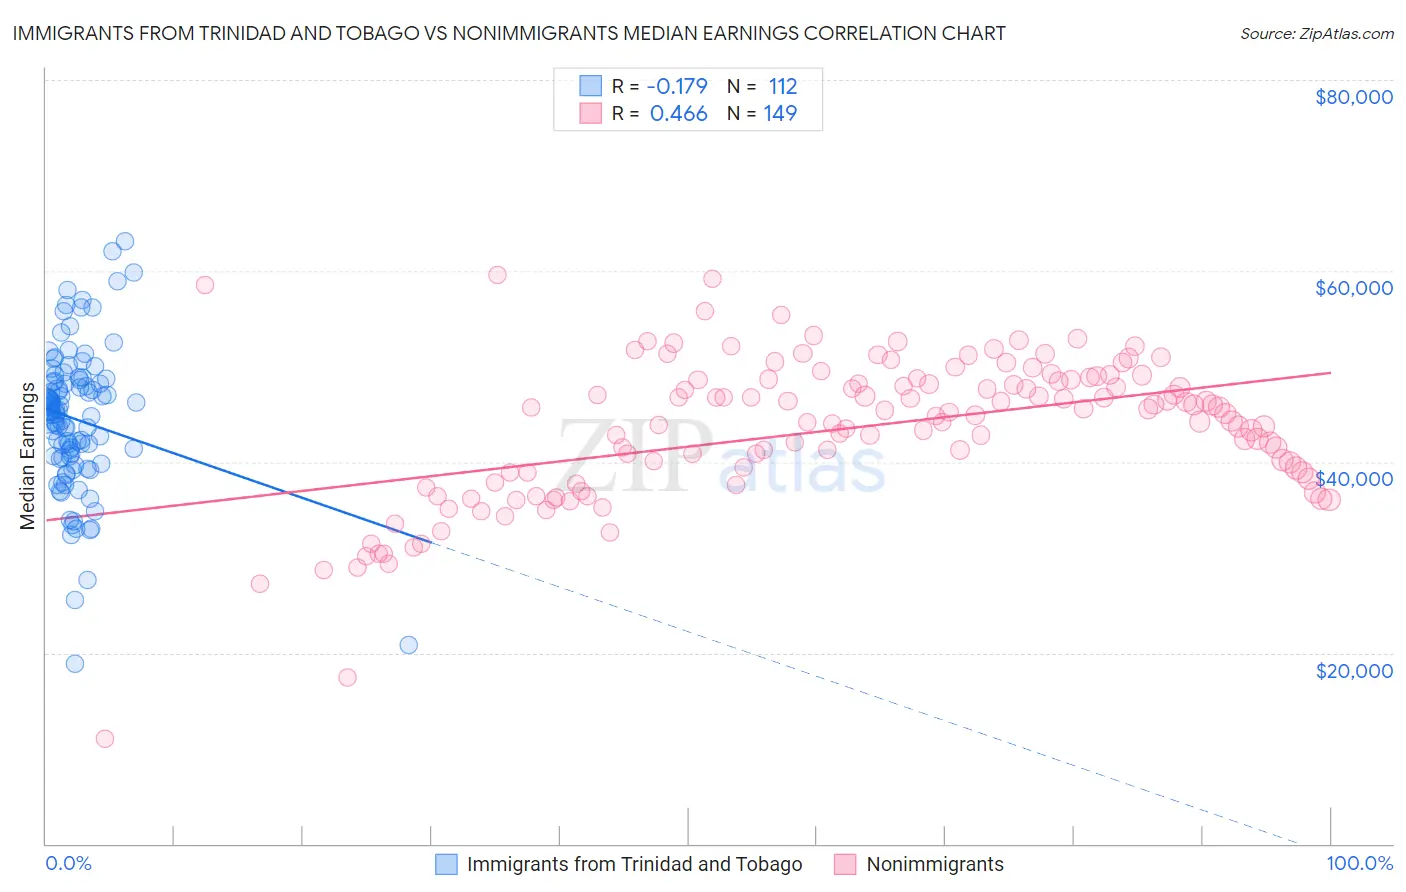
Immigrants from Trinidad and Tobago vs Nonimmigrants Median Earnings Correlation Chart
The statistical analysis conducted on geographies consisting of 223,533,236 people shows a poor negative correlation between the proportion of Immigrants from Trinidad and Tobago and median earnings in the United States with a correlation coefficient (R) of -0.179 and weighted average of $45,729. Similarly, the statistical analysis conducted on geographies consisting of 583,813,496 people shows a moderate positive correlation between the proportion of Nonimmigrants and median earnings in the United States with a correlation coefficient (R) of 0.466 and weighted average of $44,117, a difference of 3.6%.
Median Earnings Correlation Summary
| Measurement | Immigrants from Trinidad and Tobago | Nonimmigrants |
| Minimum | $18,800 | $10,941 |
| Maximum | $63,173 | $59,517 |
| Range | $44,373 | $48,576 |
| Mean | $44,457 | $43,445 |
| Median | $45,233 | $45,090 |
| Interquartile 25% (IQ1) | $40,492 | $38,540 |
| Interquartile 75% (IQ3) | $48,494 | $48,620 |
| Interquartile Range (IQR) | $8,002 | $10,080 |
| Standard Deviation (Sample) | $7,633 | $7,587 |
| Standard Deviation (Population) | $7,598 | $7,562 |
Similar Demographics by Median Earnings
Demographics Similar to Immigrants from Trinidad and Tobago by Median Earnings
In terms of median earnings, the demographic groups most similar to Immigrants from Trinidad and Tobago are Celtic ($45,732, a difference of 0.010%), Welsh ($45,710, a difference of 0.040%), Immigrants from Uruguay ($45,682, a difference of 0.10%), Tongan ($45,665, a difference of 0.14%), and Immigrants from the Azores ($45,812, a difference of 0.18%).
| Demographics | Rating | Rank | Median Earnings |
| Immigrants | St. Vincent and the Grenadines | 32.4 /100 | #195 | Fair $45,908 |
| Yugoslavians | 30.5 /100 | #196 | Fair $45,846 |
| Barbadians | 30.5 /100 | #197 | Fair $45,846 |
| Trinidadians and Tobagonians | 29.7 /100 | #198 | Fair $45,820 |
| Immigrants | Barbados | 29.6 /100 | #199 | Fair $45,816 |
| Immigrants | Azores | 29.5 /100 | #200 | Fair $45,812 |
| Celtics | 27.2 /100 | #201 | Fair $45,732 |
| Immigrants | Trinidad and Tobago | 27.1 /100 | #202 | Fair $45,729 |
| Welsh | 26.6 /100 | #203 | Fair $45,710 |
| Immigrants | Uruguay | 25.9 /100 | #204 | Fair $45,682 |
| Tongans | 25.4 /100 | #205 | Fair $45,665 |
| Immigrants | Ghana | 24.8 /100 | #206 | Fair $45,641 |
| Immigrants | Senegal | 24.0 /100 | #207 | Fair $45,611 |
| Immigrants | Bosnia and Herzegovina | 23.7 /100 | #208 | Fair $45,600 |
| Immigrants | Thailand | 23.7 /100 | #209 | Fair $45,598 |
Demographics Similar to Nonimmigrants by Median Earnings
In terms of median earnings, the demographic groups most similar to Nonimmigrants are Subsaharan African ($44,118, a difference of 0.0%), Immigrants from Venezuela ($44,163, a difference of 0.10%), Samoan ($44,206, a difference of 0.20%), Immigrants from Burma/Myanmar ($43,998, a difference of 0.27%), and Aleut ($44,241, a difference of 0.28%).
| Demographics | Rating | Rank | Median Earnings |
| Immigrants | Ecuador | 5.9 /100 | #237 | Tragic $44,462 |
| Sudanese | 5.6 /100 | #238 | Tragic $44,419 |
| Senegalese | 5.3 /100 | #239 | Tragic $44,373 |
| Aleuts | 4.4 /100 | #240 | Tragic $44,241 |
| Samoans | 4.2 /100 | #241 | Tragic $44,206 |
| Immigrants | Venezuela | 4.0 /100 | #242 | Tragic $44,163 |
| Sub-Saharan Africans | 3.7 /100 | #243 | Tragic $44,118 |
| Immigrants | Nonimmigrants | 3.7 /100 | #244 | Tragic $44,117 |
| Immigrants | Burma/Myanmar | 3.2 /100 | #245 | Tragic $43,998 |
| Immigrants | West Indies | 3.1 /100 | #246 | Tragic $43,989 |
| Immigrants | Cabo Verde | 3.0 /100 | #247 | Tragic $43,963 |
| Nepalese | 2.6 /100 | #248 | Tragic $43,860 |
| Malaysians | 2.6 /100 | #249 | Tragic $43,844 |
| Alaska Natives | 2.3 /100 | #250 | Tragic $43,750 |
| Tsimshian | 2.1 /100 | #251 | Tragic $43,695 |