Celtic vs Nonimmigrants Seniors Poverty Over the Age of 65
COMPARE
Celtic
Nonimmigrants
Seniors Poverty Over the Age of 65
Seniors Poverty Over the Age of 65 Comparison
Celtics
Nonimmigrants
9.8%
SENIORS POVERTY OVER THE AGE OF 65
99.0/ 100
METRIC RATING
60th/ 347
METRIC RANK
10.9%
SENIORS POVERTY OVER THE AGE OF 65
55.1/ 100
METRIC RATING
171st/ 347
METRIC RANK
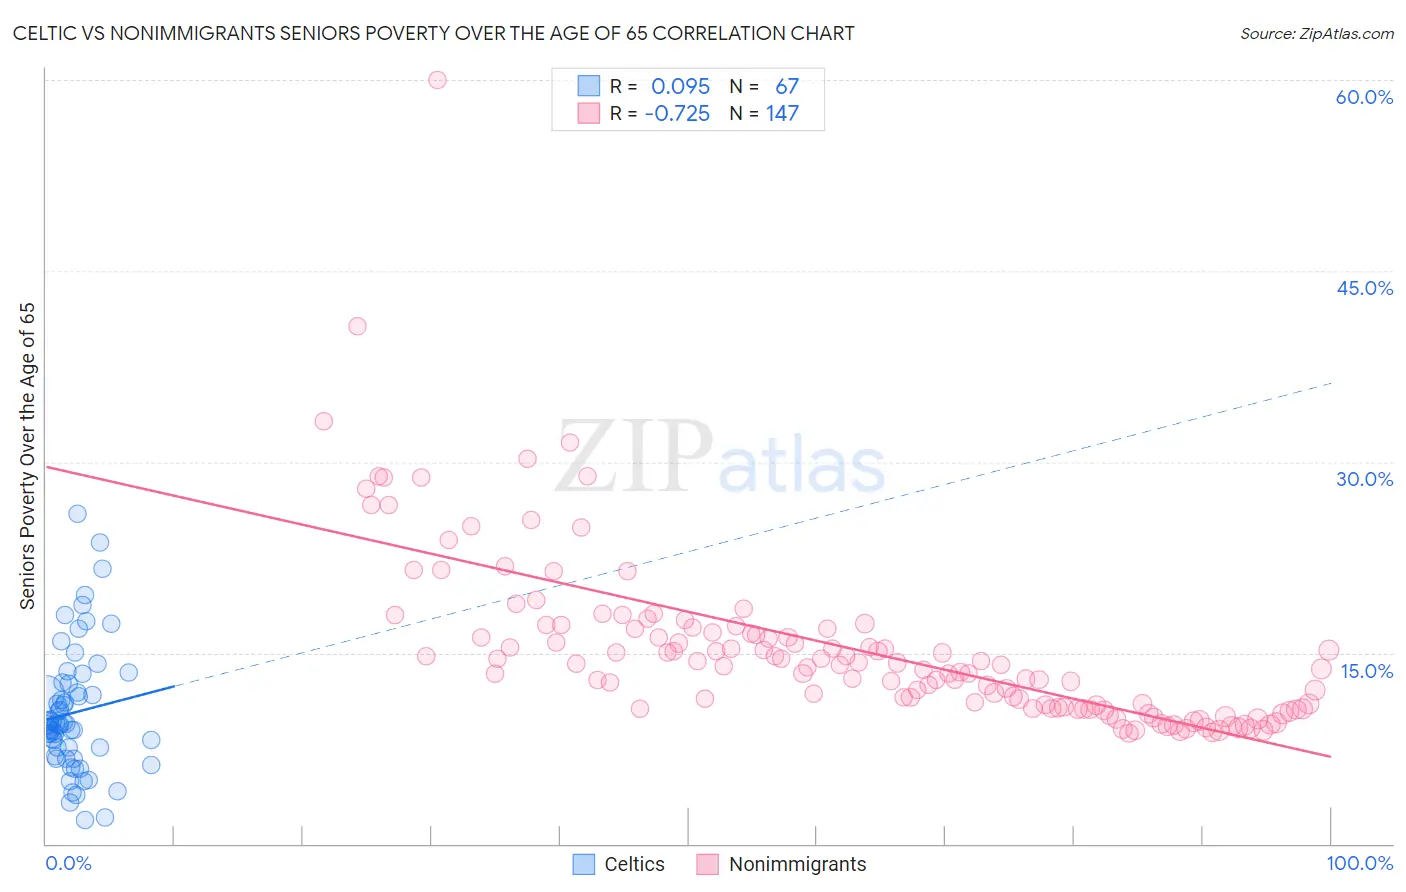
Celtic vs Nonimmigrants Seniors Poverty Over the Age of 65 Correlation Chart
The statistical analysis conducted on geographies consisting of 168,620,059 people shows a slight positive correlation between the proportion of Celtics and poverty level among seniors over the age of 65 in the United States with a correlation coefficient (R) of 0.095 and weighted average of 9.8%. Similarly, the statistical analysis conducted on geographies consisting of 577,791,291 people shows a strong negative correlation between the proportion of Nonimmigrants and poverty level among seniors over the age of 65 in the United States with a correlation coefficient (R) of -0.725 and weighted average of 10.9%, a difference of 10.8%.
Seniors Poverty Over the Age of 65 Correlation Summary
| Measurement | Celtic | Nonimmigrants |
| Minimum | 1.8% | 8.7% |
| Maximum | 26.0% | 60.0% |
| Range | 24.1% | 51.3% |
| Mean | 10.3% | 15.3% |
| Median | 9.4% | 14.0% |
| Interquartile 25% (IQ1) | 6.9% | 10.6% |
| Interquartile 75% (IQ3) | 12.5% | 16.9% |
| Interquartile Range (IQR) | 5.6% | 6.2% |
| Standard Deviation (Sample) | 4.9% | 6.8% |
| Standard Deviation (Population) | 4.9% | 6.8% |
Similar Demographics by Seniors Poverty Over the Age of 65
Demographics Similar to Celtics by Seniors Poverty Over the Age of 65
In terms of seniors poverty over the age of 65, the demographic groups most similar to Celtics are Immigrants from Canada (9.8%, a difference of 0.030%), Iranian (9.8%, a difference of 0.080%), French Canadian (9.8%, a difference of 0.13%), Serbian (9.8%, a difference of 0.18%), and Bolivian (9.8%, a difference of 0.25%).
| Demographics | Rating | Rank | Seniors Poverty Over the Age of 65 |
| Slavs | 99.2 /100 | #53 | Exceptional 9.8% |
| Immigrants | Northern Europe | 99.2 /100 | #54 | Exceptional 9.8% |
| Afghans | 99.2 /100 | #55 | Exceptional 9.8% |
| Immigrants | England | 99.1 /100 | #56 | Exceptional 9.8% |
| Bolivians | 99.1 /100 | #57 | Exceptional 9.8% |
| Serbians | 99.1 /100 | #58 | Exceptional 9.8% |
| Immigrants | Canada | 99.0 /100 | #59 | Exceptional 9.8% |
| Celtics | 99.0 /100 | #60 | Exceptional 9.8% |
| Iranians | 98.9 /100 | #61 | Exceptional 9.8% |
| French Canadians | 98.9 /100 | #62 | Exceptional 9.8% |
| Macedonians | 98.8 /100 | #63 | Exceptional 9.9% |
| Immigrants | North America | 98.8 /100 | #64 | Exceptional 9.9% |
| Pennsylvania Germans | 98.7 /100 | #65 | Exceptional 9.9% |
| Immigrants | Netherlands | 98.7 /100 | #66 | Exceptional 9.9% |
| Immigrants | Austria | 98.6 /100 | #67 | Exceptional 9.9% |
Demographics Similar to Nonimmigrants by Seniors Poverty Over the Age of 65
In terms of seniors poverty over the age of 65, the demographic groups most similar to Nonimmigrants are Immigrants from Syria (10.9%, a difference of 0.040%), Immigrants from Eastern Europe (10.9%, a difference of 0.060%), Sri Lankan (10.9%, a difference of 0.16%), Mongolian (10.9%, a difference of 0.26%), and Spaniard (10.9%, a difference of 0.39%).
| Demographics | Rating | Rank | Seniors Poverty Over the Age of 65 |
| Potawatomi | 62.6 /100 | #164 | Good 10.8% |
| Immigrants | South Eastern Asia | 62.1 /100 | #165 | Good 10.8% |
| Malaysians | 62.0 /100 | #166 | Good 10.8% |
| Alaska Natives | 60.3 /100 | #167 | Good 10.8% |
| Mongolians | 58.0 /100 | #168 | Average 10.9% |
| Sri Lankans | 56.8 /100 | #169 | Average 10.9% |
| Immigrants | Eastern Europe | 55.8 /100 | #170 | Average 10.9% |
| Immigrants | Nonimmigrants | 55.1 /100 | #171 | Average 10.9% |
| Immigrants | Syria | 54.7 /100 | #172 | Average 10.9% |
| Spaniards | 50.7 /100 | #173 | Average 10.9% |
| Immigrants | Sudan | 50.0 /100 | #174 | Average 10.9% |
| Creek | 49.6 /100 | #175 | Average 10.9% |
| Immigrants | Malaysia | 47.9 /100 | #176 | Average 11.0% |
| Cherokee | 47.3 /100 | #177 | Average 11.0% |
| German Russians | 46.9 /100 | #178 | Average 11.0% |