Immigrants from Brazil vs Immigrants from Thailand Per Capita Income
COMPARE
Immigrants from Brazil
Immigrants from Thailand
Per Capita Income
Per Capita Income Comparison
Immigrants from Brazil
Immigrants from Thailand
$48,164
PER CAPITA INCOME
99.4/ 100
METRIC RATING
83rd/ 347
METRIC RANK
$42,289
PER CAPITA INCOME
17.6/ 100
METRIC RATING
201st/ 347
METRIC RANK
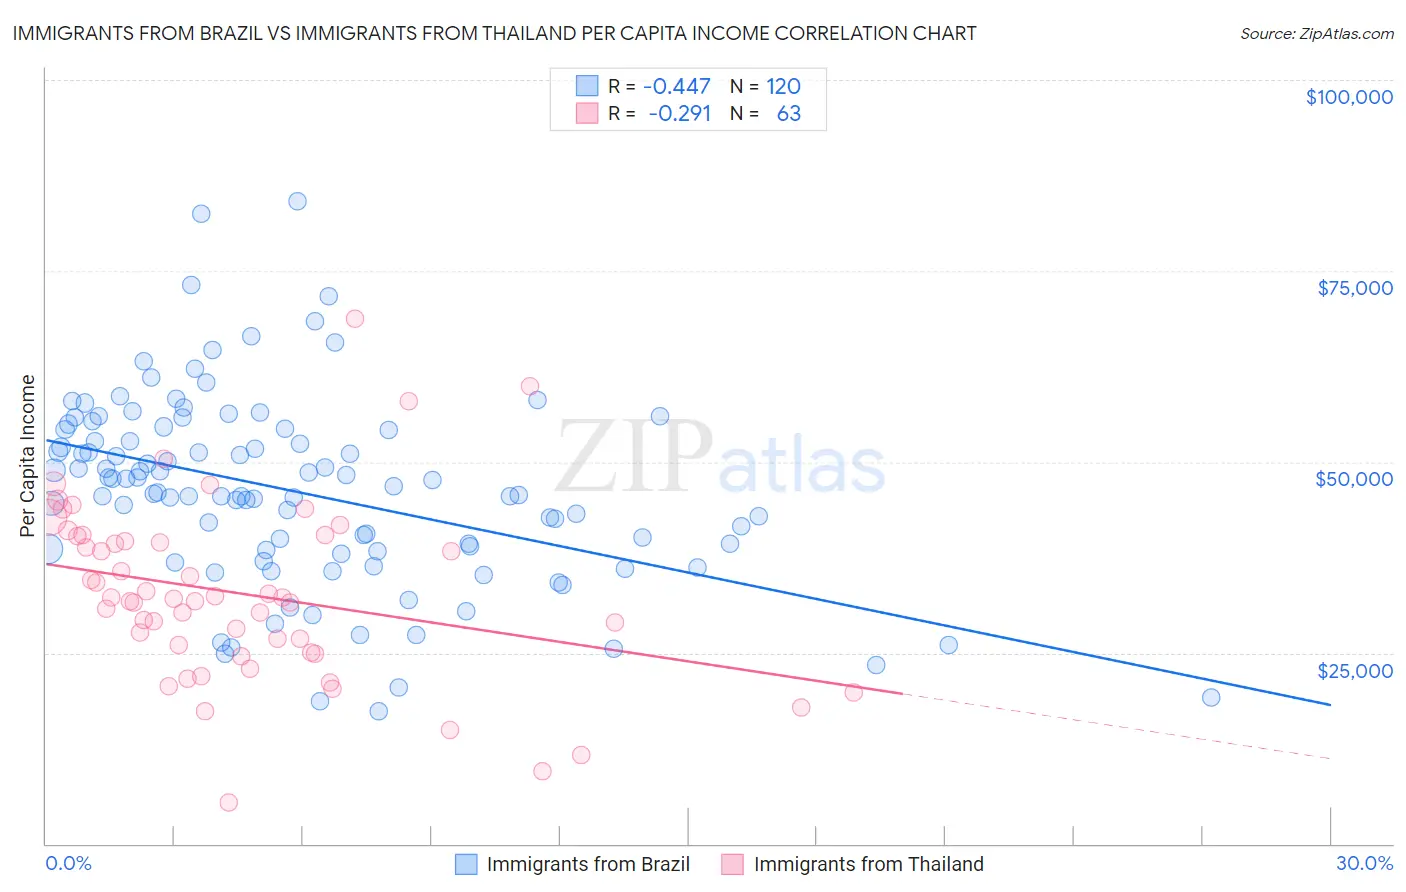
Immigrants from Brazil vs Immigrants from Thailand Per Capita Income Correlation Chart
The statistical analysis conducted on geographies consisting of 343,026,133 people shows a moderate negative correlation between the proportion of Immigrants from Brazil and per capita income in the United States with a correlation coefficient (R) of -0.447 and weighted average of $48,164. Similarly, the statistical analysis conducted on geographies consisting of 317,026,349 people shows a weak negative correlation between the proportion of Immigrants from Thailand and per capita income in the United States with a correlation coefficient (R) of -0.291 and weighted average of $42,289, a difference of 13.9%.
Per Capita Income Correlation Summary
| Measurement | Immigrants from Brazil | Immigrants from Thailand |
| Minimum | $17,376 | $5,324 |
| Maximum | $84,094 | $68,712 |
| Range | $66,718 | $63,388 |
| Mean | $46,035 | $32,742 |
| Median | $45,902 | $32,020 |
| Interquartile 25% (IQ1) | $38,349 | $24,989 |
| Interquartile 75% (IQ3) | $54,171 | $40,306 |
| Interquartile Range (IQR) | $15,822 | $15,317 |
| Standard Deviation (Sample) | $12,485 | $11,676 |
| Standard Deviation (Population) | $12,433 | $11,583 |
Similar Demographics by Per Capita Income
Demographics Similar to Immigrants from Brazil by Per Capita Income
In terms of per capita income, the demographic groups most similar to Immigrants from Brazil are Immigrants from Indonesia ($48,195, a difference of 0.060%), Immigrants from Ukraine ($48,134, a difference of 0.060%), Austrian ($48,116, a difference of 0.10%), Armenian ($48,287, a difference of 0.26%), and Immigrants from Southern Europe ($48,027, a difference of 0.29%).
| Demographics | Rating | Rank | Per Capita Income |
| Immigrants | England | 99.7 /100 | #76 | Exceptional $48,844 |
| Immigrants | Kazakhstan | 99.7 /100 | #77 | Exceptional $48,747 |
| Immigrants | Italy | 99.6 /100 | #78 | Exceptional $48,654 |
| Romanians | 99.5 /100 | #79 | Exceptional $48,445 |
| Egyptians | 99.5 /100 | #80 | Exceptional $48,358 |
| Armenians | 99.4 /100 | #81 | Exceptional $48,287 |
| Immigrants | Indonesia | 99.4 /100 | #82 | Exceptional $48,195 |
| Immigrants | Brazil | 99.4 /100 | #83 | Exceptional $48,164 |
| Immigrants | Ukraine | 99.3 /100 | #84 | Exceptional $48,134 |
| Austrians | 99.3 /100 | #85 | Exceptional $48,116 |
| Immigrants | Southern Europe | 99.3 /100 | #86 | Exceptional $48,027 |
| Ukrainians | 99.3 /100 | #87 | Exceptional $48,014 |
| Croatians | 99.0 /100 | #88 | Exceptional $47,742 |
| Northern Europeans | 98.9 /100 | #89 | Exceptional $47,698 |
| Italians | 98.8 /100 | #90 | Exceptional $47,574 |
Demographics Similar to Immigrants from Thailand by Per Capita Income
In terms of per capita income, the demographic groups most similar to Immigrants from Thailand are Immigrants from Bosnia and Herzegovina ($42,278, a difference of 0.030%), Spanish ($42,249, a difference of 0.090%), Vietnamese ($42,368, a difference of 0.19%), Aleut ($42,210, a difference of 0.19%), and White/Caucasian ($42,180, a difference of 0.26%).
| Demographics | Rating | Rank | Per Capita Income |
| Immigrants | Fiji | 25.2 /100 | #194 | Fair $42,694 |
| Immigrants | Kenya | 24.5 /100 | #195 | Fair $42,661 |
| Dutch | 23.4 /100 | #196 | Fair $42,605 |
| Scotch-Irish | 22.6 /100 | #197 | Fair $42,563 |
| Immigrants | Portugal | 19.7 /100 | #198 | Poor $42,412 |
| Barbadians | 19.6 /100 | #199 | Poor $42,406 |
| Vietnamese | 19.0 /100 | #200 | Poor $42,368 |
| Immigrants | Thailand | 17.6 /100 | #201 | Poor $42,289 |
| Immigrants | Bosnia and Herzegovina | 17.5 /100 | #202 | Poor $42,278 |
| Spanish | 17.0 /100 | #203 | Poor $42,249 |
| Aleuts | 16.4 /100 | #204 | Poor $42,210 |
| Whites/Caucasians | 15.9 /100 | #205 | Poor $42,180 |
| Ghanaians | 15.7 /100 | #206 | Poor $42,164 |
| Venezuelans | 14.4 /100 | #207 | Poor $42,074 |
| Panamanians | 13.9 /100 | #208 | Poor $42,035 |