Immigrants from Israel vs Immigrants from Thailand Per Capita Income
COMPARE
Immigrants from Israel
Immigrants from Thailand
Per Capita Income
Per Capita Income Comparison
Immigrants from Israel
Immigrants from Thailand
$57,384
PER CAPITA INCOME
100.0/ 100
METRIC RATING
7th/ 347
METRIC RANK
$42,289
PER CAPITA INCOME
17.6/ 100
METRIC RATING
201st/ 347
METRIC RANK
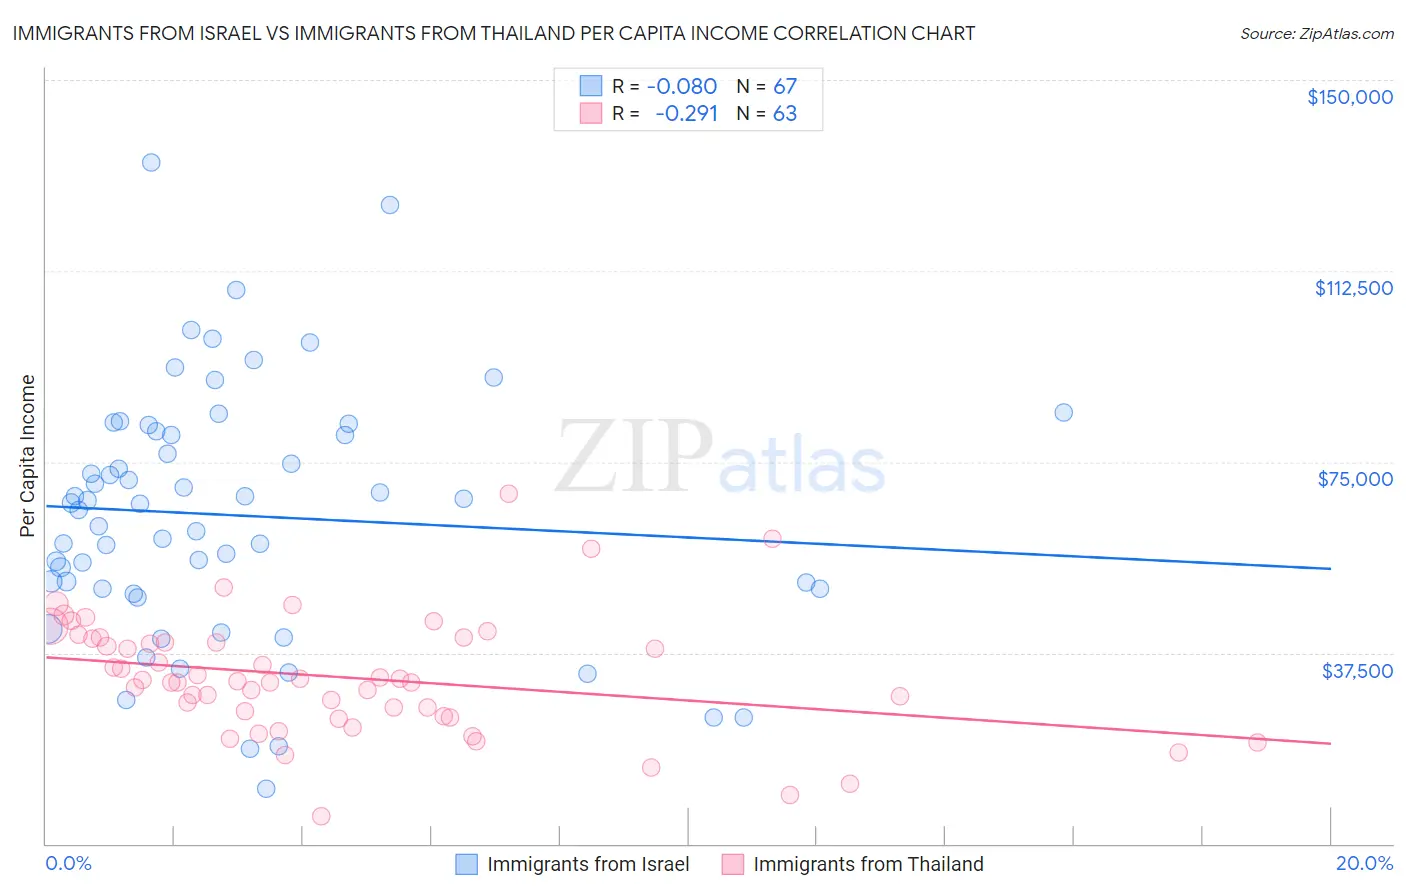
Immigrants from Israel vs Immigrants from Thailand Per Capita Income Correlation Chart
The statistical analysis conducted on geographies consisting of 210,034,998 people shows a slight negative correlation between the proportion of Immigrants from Israel and per capita income in the United States with a correlation coefficient (R) of -0.080 and weighted average of $57,384. Similarly, the statistical analysis conducted on geographies consisting of 317,026,349 people shows a weak negative correlation between the proportion of Immigrants from Thailand and per capita income in the United States with a correlation coefficient (R) of -0.291 and weighted average of $42,289, a difference of 35.7%.
Per Capita Income Correlation Summary
| Measurement | Immigrants from Israel | Immigrants from Thailand |
| Minimum | $10,922 | $5,324 |
| Maximum | $133,703 | $68,712 |
| Range | $122,781 | $63,388 |
| Mean | $64,480 | $32,742 |
| Median | $66,721 | $32,020 |
| Interquartile 25% (IQ1) | $50,016 | $24,989 |
| Interquartile 75% (IQ3) | $80,903 | $40,306 |
| Interquartile Range (IQR) | $30,888 | $15,317 |
| Standard Deviation (Sample) | $24,657 | $11,676 |
| Standard Deviation (Population) | $24,473 | $11,583 |
Similar Demographics by Per Capita Income
Demographics Similar to Immigrants from Israel by Per Capita Income
In terms of per capita income, the demographic groups most similar to Immigrants from Israel are Immigrants from Taiwan ($57,742, a difference of 0.62%), Immigrants from Iran ($57,759, a difference of 0.65%), Immigrants from Australia ($57,953, a difference of 0.99%), Immigrants from Hong Kong ($56,709, a difference of 1.2%), and Immigrants from Ireland ($56,584, a difference of 1.4%).
| Demographics | Rating | Rank | Per Capita Income |
| Filipinos | 100.0 /100 | #1 | Exceptional $59,066 |
| Iranians | 100.0 /100 | #2 | Exceptional $58,786 |
| Immigrants | Singapore | 100.0 /100 | #3 | Exceptional $58,353 |
| Immigrants | Australia | 100.0 /100 | #4 | Exceptional $57,953 |
| Immigrants | Iran | 100.0 /100 | #5 | Exceptional $57,759 |
| Immigrants | Taiwan | 100.0 /100 | #6 | Exceptional $57,742 |
| Immigrants | Israel | 100.0 /100 | #7 | Exceptional $57,384 |
| Immigrants | Hong Kong | 100.0 /100 | #8 | Exceptional $56,709 |
| Immigrants | Ireland | 100.0 /100 | #9 | Exceptional $56,584 |
| Okinawans | 100.0 /100 | #10 | Exceptional $55,817 |
| Eastern Europeans | 100.0 /100 | #11 | Exceptional $55,780 |
| Immigrants | Sweden | 100.0 /100 | #12 | Exceptional $55,582 |
| Immigrants | India | 100.0 /100 | #13 | Exceptional $55,268 |
| Immigrants | Belgium | 100.0 /100 | #14 | Exceptional $55,082 |
| Cypriots | 100.0 /100 | #15 | Exceptional $54,899 |
Demographics Similar to Immigrants from Thailand by Per Capita Income
In terms of per capita income, the demographic groups most similar to Immigrants from Thailand are Immigrants from Bosnia and Herzegovina ($42,278, a difference of 0.030%), Spanish ($42,249, a difference of 0.090%), Vietnamese ($42,368, a difference of 0.19%), Aleut ($42,210, a difference of 0.19%), and White/Caucasian ($42,180, a difference of 0.26%).
| Demographics | Rating | Rank | Per Capita Income |
| Immigrants | Fiji | 25.2 /100 | #194 | Fair $42,694 |
| Immigrants | Kenya | 24.5 /100 | #195 | Fair $42,661 |
| Dutch | 23.4 /100 | #196 | Fair $42,605 |
| Scotch-Irish | 22.6 /100 | #197 | Fair $42,563 |
| Immigrants | Portugal | 19.7 /100 | #198 | Poor $42,412 |
| Barbadians | 19.6 /100 | #199 | Poor $42,406 |
| Vietnamese | 19.0 /100 | #200 | Poor $42,368 |
| Immigrants | Thailand | 17.6 /100 | #201 | Poor $42,289 |
| Immigrants | Bosnia and Herzegovina | 17.5 /100 | #202 | Poor $42,278 |
| Spanish | 17.0 /100 | #203 | Poor $42,249 |
| Aleuts | 16.4 /100 | #204 | Poor $42,210 |
| Whites/Caucasians | 15.9 /100 | #205 | Poor $42,180 |
| Ghanaians | 15.7 /100 | #206 | Poor $42,164 |
| Venezuelans | 14.4 /100 | #207 | Poor $42,074 |
| Panamanians | 13.9 /100 | #208 | Poor $42,035 |