Celtic vs Immigrants from Dominican Republic Median Male Earnings
COMPARE
Celtic
Immigrants from Dominican Republic
Median Male Earnings
Median Male Earnings Comparison
Celtics
Immigrants from Dominican Republic
$54,242
MEDIAN MALE EARNINGS
43.9/ 100
METRIC RATING
179th/ 347
METRIC RANK
$46,655
MEDIAN MALE EARNINGS
0.0/ 100
METRIC RATING
307th/ 347
METRIC RANK
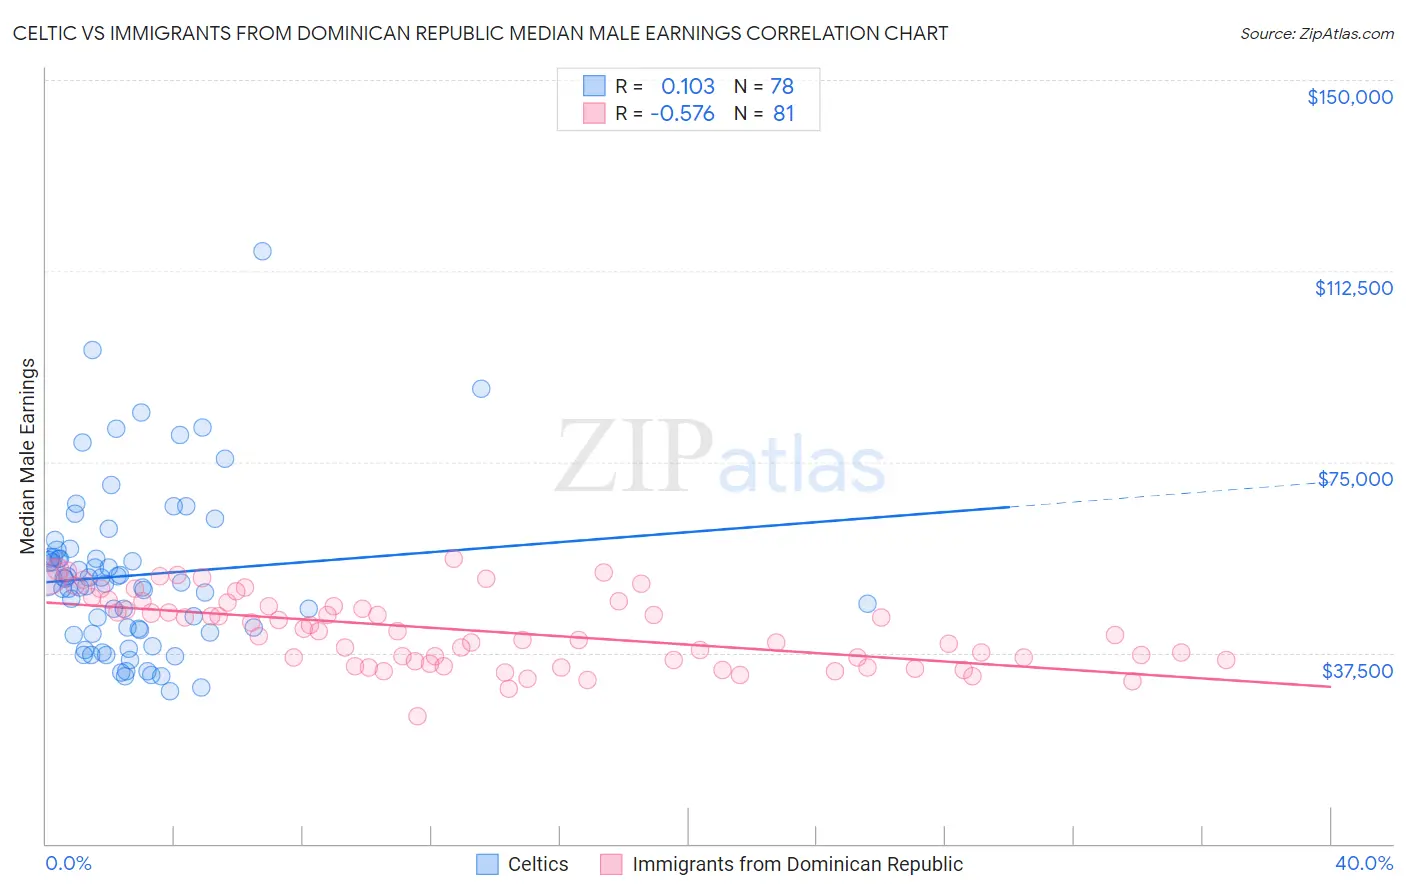
Celtic vs Immigrants from Dominican Republic Median Male Earnings Correlation Chart
The statistical analysis conducted on geographies consisting of 168,835,253 people shows a poor positive correlation between the proportion of Celtics and median male earnings in the United States with a correlation coefficient (R) of 0.103 and weighted average of $54,242. Similarly, the statistical analysis conducted on geographies consisting of 274,998,271 people shows a substantial negative correlation between the proportion of Immigrants from Dominican Republic and median male earnings in the United States with a correlation coefficient (R) of -0.576 and weighted average of $46,655, a difference of 16.3%.
Median Male Earnings Correlation Summary
| Measurement | Celtic | Immigrants from Dominican Republic |
| Minimum | $30,000 | $24,931 |
| Maximum | $116,250 | $56,014 |
| Range | $86,250 | $31,083 |
| Mean | $52,737 | $41,875 |
| Median | $51,157 | $41,710 |
| Interquartile 25% (IQ1) | $41,563 | $35,983 |
| Interquartile 75% (IQ3) | $56,235 | $47,499 |
| Interquartile Range (IQR) | $14,672 | $11,516 |
| Standard Deviation (Sample) | $16,099 | $7,016 |
| Standard Deviation (Population) | $15,995 | $6,972 |
Similar Demographics by Median Male Earnings
Demographics Similar to Celtics by Median Male Earnings
In terms of median male earnings, the demographic groups most similar to Celtics are Costa Rican ($54,279, a difference of 0.070%), Sierra Leonean ($54,279, a difference of 0.070%), Iraqi ($54,182, a difference of 0.11%), Immigrants ($54,168, a difference of 0.14%), and Spaniard ($54,401, a difference of 0.29%).
| Demographics | Rating | Rank | Median Male Earnings |
| Welsh | 53.8 /100 | #172 | Average $54,647 |
| South American Indians | 50.4 /100 | #173 | Average $54,508 |
| South Americans | 50.0 /100 | #174 | Average $54,492 |
| Dutch | 48.0 /100 | #175 | Average $54,410 |
| Spaniards | 47.8 /100 | #176 | Average $54,401 |
| Costa Ricans | 44.8 /100 | #177 | Average $54,279 |
| Sierra Leoneans | 44.8 /100 | #178 | Average $54,279 |
| Celtics | 43.9 /100 | #179 | Average $54,242 |
| Iraqis | 42.5 /100 | #180 | Average $54,182 |
| Immigrants | Immigrants | 42.1 /100 | #181 | Average $54,168 |
| Yugoslavians | 37.4 /100 | #182 | Fair $53,967 |
| Immigrants | South America | 37.3 /100 | #183 | Fair $53,962 |
| Whites/Caucasians | 36.5 /100 | #184 | Fair $53,925 |
| Immigrants | Sierra Leone | 36.0 /100 | #185 | Fair $53,905 |
| Colombians | 34.4 /100 | #186 | Fair $53,832 |
Demographics Similar to Immigrants from Dominican Republic by Median Male Earnings
In terms of median male earnings, the demographic groups most similar to Immigrants from Dominican Republic are Dutch West Indian ($46,656, a difference of 0.0%), Ottawa ($46,611, a difference of 0.090%), Creek ($46,594, a difference of 0.13%), Cuban ($46,580, a difference of 0.16%), and Guatemalan ($46,736, a difference of 0.17%).
| Demographics | Rating | Rank | Median Male Earnings |
| U.S. Virgin Islanders | 0.1 /100 | #300 | Tragic $47,066 |
| Immigrants | Latin America | 0.1 /100 | #301 | Tragic $46,941 |
| Seminole | 0.1 /100 | #302 | Tragic $46,783 |
| Yaqui | 0.1 /100 | #303 | Tragic $46,777 |
| Bangladeshis | 0.1 /100 | #304 | Tragic $46,744 |
| Guatemalans | 0.0 /100 | #305 | Tragic $46,736 |
| Dutch West Indians | 0.0 /100 | #306 | Tragic $46,656 |
| Immigrants | Dominican Republic | 0.0 /100 | #307 | Tragic $46,655 |
| Ottawa | 0.0 /100 | #308 | Tragic $46,611 |
| Creek | 0.0 /100 | #309 | Tragic $46,594 |
| Cubans | 0.0 /100 | #310 | Tragic $46,580 |
| Apache | 0.0 /100 | #311 | Tragic $46,429 |
| Hispanics or Latinos | 0.0 /100 | #312 | Tragic $46,419 |
| Hondurans | 0.0 /100 | #313 | Tragic $46,374 |
| Chippewa | 0.0 /100 | #314 | Tragic $46,368 |