Immigrants from Vietnam vs Immigrants from the Azores Median Male Earnings
COMPARE
Immigrants from Vietnam
Immigrants from the Azores
Median Male Earnings
Median Male Earnings Comparison
Immigrants from Vietnam
Immigrants from the Azores
$54,913
MEDIAN MALE EARNINGS
60.2/ 100
METRIC RATING
168th/ 347
METRIC RANK
$53,503
MEDIAN MALE EARNINGS
27.5/ 100
METRIC RATING
195th/ 347
METRIC RANK
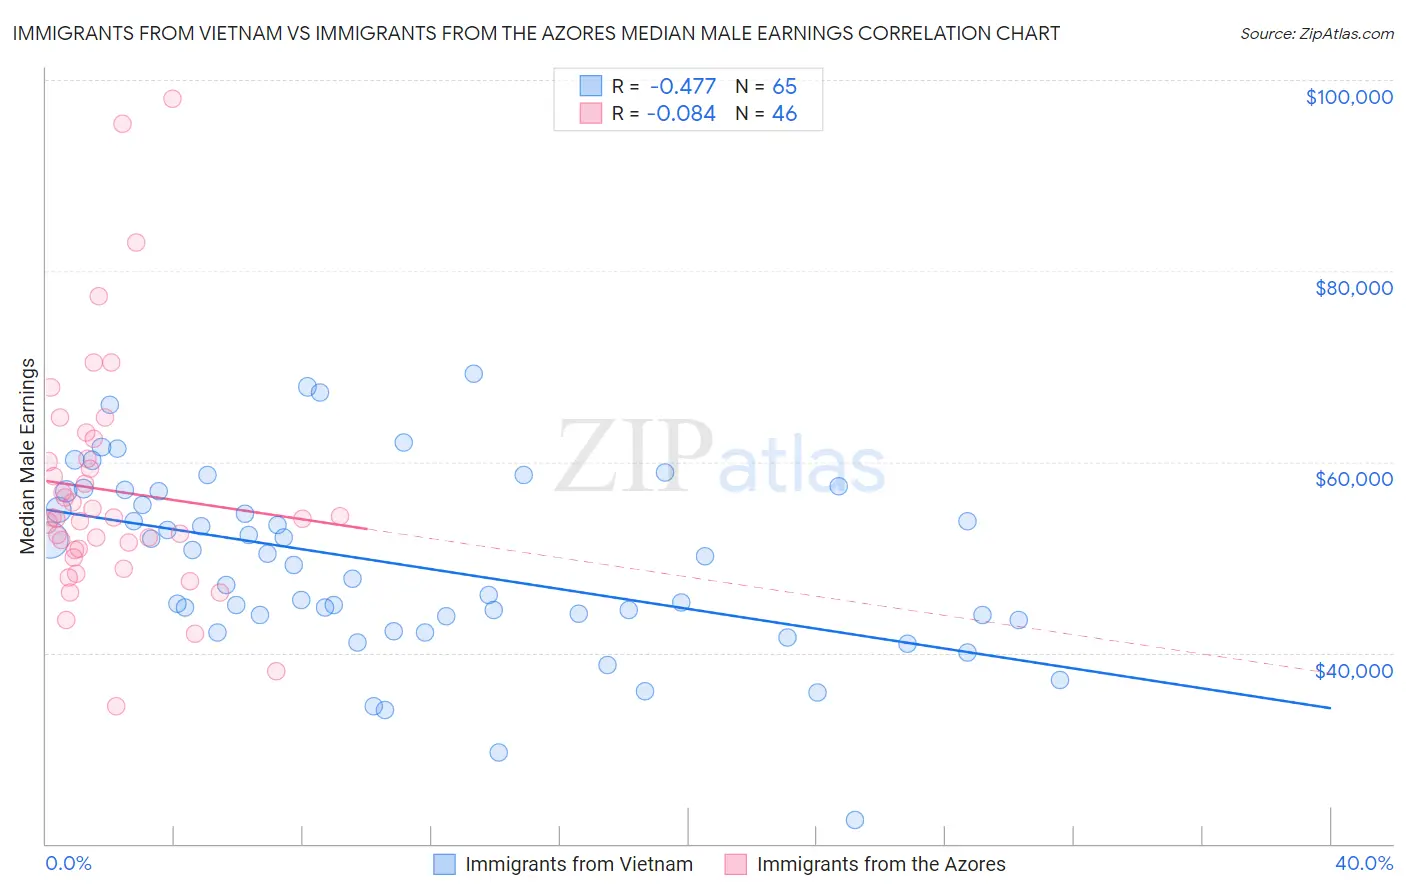
Immigrants from Vietnam vs Immigrants from the Azores Median Male Earnings Correlation Chart
The statistical analysis conducted on geographies consisting of 404,603,118 people shows a moderate negative correlation between the proportion of Immigrants from Vietnam and median male earnings in the United States with a correlation coefficient (R) of -0.477 and weighted average of $54,913. Similarly, the statistical analysis conducted on geographies consisting of 46,248,133 people shows a slight negative correlation between the proportion of Immigrants from the Azores and median male earnings in the United States with a correlation coefficient (R) of -0.084 and weighted average of $53,503, a difference of 2.6%.
Median Male Earnings Correlation Summary
| Measurement | Immigrants from Vietnam | Immigrants from the Azores |
| Minimum | $22,532 | $34,438 |
| Maximum | $69,274 | $98,000 |
| Range | $46,742 | $63,562 |
| Mean | $49,248 | $56,998 |
| Median | $49,189 | $54,107 |
| Interquartile 25% (IQ1) | $43,623 | $50,771 |
| Interquartile 75% (IQ3) | $56,949 | $60,281 |
| Interquartile Range (IQR) | $13,326 | $9,510 |
| Standard Deviation (Sample) | $9,503 | $12,557 |
| Standard Deviation (Population) | $9,429 | $12,419 |
Similar Demographics by Median Male Earnings
Demographics Similar to Immigrants from Vietnam by Median Male Earnings
In terms of median male earnings, the demographic groups most similar to Immigrants from Vietnam are Immigrants from Fiji ($54,958, a difference of 0.080%), German ($54,974, a difference of 0.11%), French Canadian ($54,722, a difference of 0.35%), Finnish ($54,721, a difference of 0.35%), and Immigrants from Peru ($54,695, a difference of 0.40%).
| Demographics | Rating | Rank | Median Male Earnings |
| Belgians | 70.1 /100 | #161 | Good $55,361 |
| French | 69.9 /100 | #162 | Good $55,350 |
| Ugandans | 68.6 /100 | #163 | Good $55,290 |
| Immigrants | South Eastern Asia | 67.6 /100 | #164 | Good $55,241 |
| Immigrants | Portugal | 66.3 /100 | #165 | Good $55,182 |
| Germans | 61.6 /100 | #166 | Good $54,974 |
| Immigrants | Fiji | 61.2 /100 | #167 | Good $54,958 |
| Immigrants | Vietnam | 60.2 /100 | #168 | Good $54,913 |
| French Canadians | 55.6 /100 | #169 | Average $54,722 |
| Finns | 55.6 /100 | #170 | Average $54,721 |
| Immigrants | Peru | 54.9 /100 | #171 | Average $54,695 |
| Welsh | 53.8 /100 | #172 | Average $54,647 |
| South American Indians | 50.4 /100 | #173 | Average $54,508 |
| South Americans | 50.0 /100 | #174 | Average $54,492 |
| Dutch | 48.0 /100 | #175 | Average $54,410 |
Demographics Similar to Immigrants from the Azores by Median Male Earnings
In terms of median male earnings, the demographic groups most similar to Immigrants from the Azores are Immigrants from Africa ($53,457, a difference of 0.090%), Spanish ($53,576, a difference of 0.14%), Immigrants from Kenya ($53,427, a difference of 0.14%), Kenyan ($53,647, a difference of 0.27%), and Scotch-Irish ($53,658, a difference of 0.29%).
| Demographics | Rating | Rank | Median Male Earnings |
| Immigrants | Eastern Africa | 31.8 /100 | #188 | Fair $53,713 |
| Puget Sound Salish | 31.6 /100 | #189 | Fair $53,704 |
| Uruguayans | 31.1 /100 | #190 | Fair $53,680 |
| Guamanians/Chamorros | 30.7 /100 | #191 | Fair $53,661 |
| Scotch-Irish | 30.6 /100 | #192 | Fair $53,658 |
| Kenyans | 30.4 /100 | #193 | Fair $53,647 |
| Spanish | 29.0 /100 | #194 | Fair $53,576 |
| Immigrants | Azores | 27.5 /100 | #195 | Fair $53,503 |
| Immigrants | Africa | 26.6 /100 | #196 | Fair $53,457 |
| Immigrants | Kenya | 26.0 /100 | #197 | Fair $53,427 |
| Immigrants | Costa Rica | 22.6 /100 | #198 | Fair $53,237 |
| Tongans | 22.3 /100 | #199 | Fair $53,218 |
| Immigrants | Thailand | 17.5 /100 | #200 | Poor $52,908 |
| Immigrants | Bosnia and Herzegovina | 16.9 /100 | #201 | Poor $52,869 |
| Immigrants | Uruguay | 16.8 /100 | #202 | Poor $52,860 |