Immigrants from Ireland vs Immigrants from the Azores Median Male Earnings
COMPARE
Immigrants from Ireland
Immigrants from the Azores
Median Male Earnings
Median Male Earnings Comparison
Immigrants from Ireland
Immigrants from the Azores
$67,698
MEDIAN MALE EARNINGS
100.0/ 100
METRIC RATING
11th/ 347
METRIC RANK
$53,503
MEDIAN MALE EARNINGS
27.5/ 100
METRIC RATING
195th/ 347
METRIC RANK
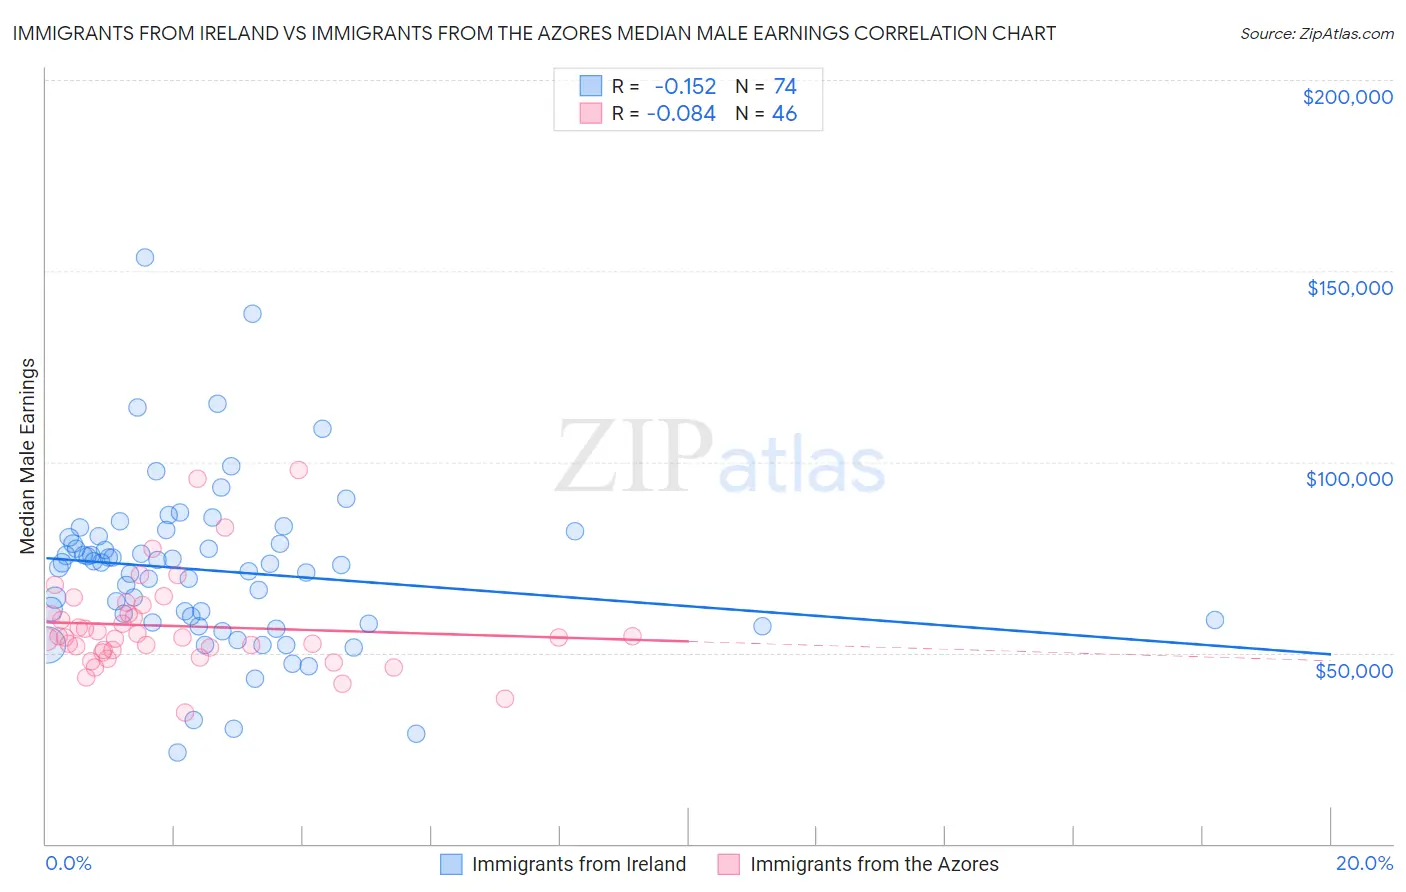
Immigrants from Ireland vs Immigrants from the Azores Median Male Earnings Correlation Chart
The statistical analysis conducted on geographies consisting of 240,726,887 people shows a poor negative correlation between the proportion of Immigrants from Ireland and median male earnings in the United States with a correlation coefficient (R) of -0.152 and weighted average of $67,698. Similarly, the statistical analysis conducted on geographies consisting of 46,248,133 people shows a slight negative correlation between the proportion of Immigrants from the Azores and median male earnings in the United States with a correlation coefficient (R) of -0.084 and weighted average of $53,503, a difference of 26.5%.
Median Male Earnings Correlation Summary
| Measurement | Immigrants from Ireland | Immigrants from the Azores |
| Minimum | $23,924 | $34,438 |
| Maximum | $153,576 | $98,000 |
| Range | $129,652 | $63,562 |
| Mean | $71,558 | $56,998 |
| Median | $73,213 | $54,107 |
| Interquartile 25% (IQ1) | $58,076 | $50,771 |
| Interquartile 75% (IQ3) | $80,238 | $60,281 |
| Interquartile Range (IQR) | $22,162 | $9,510 |
| Standard Deviation (Sample) | $21,669 | $12,557 |
| Standard Deviation (Population) | $21,523 | $12,419 |
Similar Demographics by Median Male Earnings
Demographics Similar to Immigrants from Ireland by Median Male Earnings
In terms of median male earnings, the demographic groups most similar to Immigrants from Ireland are Immigrants from Australia ($67,634, a difference of 0.090%), Immigrants from China ($67,353, a difference of 0.51%), Okinawan ($67,232, a difference of 0.69%), Immigrants from Eastern Asia ($66,903, a difference of 1.2%), and Immigrants from Israel ($68,716, a difference of 1.5%).
| Demographics | Rating | Rank | Median Male Earnings |
| Thais | 100.0 /100 | #4 | Exceptional $72,135 |
| Immigrants | Singapore | 100.0 /100 | #5 | Exceptional $71,348 |
| Iranians | 100.0 /100 | #6 | Exceptional $70,648 |
| Immigrants | Hong Kong | 100.0 /100 | #7 | Exceptional $70,146 |
| Immigrants | Iran | 100.0 /100 | #8 | Exceptional $69,284 |
| Immigrants | South Central Asia | 100.0 /100 | #9 | Exceptional $68,960 |
| Immigrants | Israel | 100.0 /100 | #10 | Exceptional $68,716 |
| Immigrants | Ireland | 100.0 /100 | #11 | Exceptional $67,698 |
| Immigrants | Australia | 100.0 /100 | #12 | Exceptional $67,634 |
| Immigrants | China | 100.0 /100 | #13 | Exceptional $67,353 |
| Okinawans | 100.0 /100 | #14 | Exceptional $67,232 |
| Immigrants | Eastern Asia | 100.0 /100 | #15 | Exceptional $66,903 |
| Eastern Europeans | 100.0 /100 | #16 | Exceptional $66,472 |
| Immigrants | Belgium | 100.0 /100 | #17 | Exceptional $66,125 |
| Indians (Asian) | 100.0 /100 | #18 | Exceptional $66,078 |
Demographics Similar to Immigrants from the Azores by Median Male Earnings
In terms of median male earnings, the demographic groups most similar to Immigrants from the Azores are Immigrants from Africa ($53,457, a difference of 0.090%), Spanish ($53,576, a difference of 0.14%), Immigrants from Kenya ($53,427, a difference of 0.14%), Kenyan ($53,647, a difference of 0.27%), and Scotch-Irish ($53,658, a difference of 0.29%).
| Demographics | Rating | Rank | Median Male Earnings |
| Immigrants | Eastern Africa | 31.8 /100 | #188 | Fair $53,713 |
| Puget Sound Salish | 31.6 /100 | #189 | Fair $53,704 |
| Uruguayans | 31.1 /100 | #190 | Fair $53,680 |
| Guamanians/Chamorros | 30.7 /100 | #191 | Fair $53,661 |
| Scotch-Irish | 30.6 /100 | #192 | Fair $53,658 |
| Kenyans | 30.4 /100 | #193 | Fair $53,647 |
| Spanish | 29.0 /100 | #194 | Fair $53,576 |
| Immigrants | Azores | 27.5 /100 | #195 | Fair $53,503 |
| Immigrants | Africa | 26.6 /100 | #196 | Fair $53,457 |
| Immigrants | Kenya | 26.0 /100 | #197 | Fair $53,427 |
| Immigrants | Costa Rica | 22.6 /100 | #198 | Fair $53,237 |
| Tongans | 22.3 /100 | #199 | Fair $53,218 |
| Immigrants | Thailand | 17.5 /100 | #200 | Poor $52,908 |
| Immigrants | Bosnia and Herzegovina | 16.9 /100 | #201 | Poor $52,869 |
| Immigrants | Uruguay | 16.8 /100 | #202 | Poor $52,860 |