Cambodian vs Immigrants from Czechoslovakia Per Capita Income
COMPARE
Cambodian
Immigrants from Czechoslovakia
Per Capita Income
Per Capita Income Comparison
Cambodians
Immigrants from Czechoslovakia
$51,731
PER CAPITA INCOME
100.0/ 100
METRIC RATING
39th/ 347
METRIC RANK
$51,770
PER CAPITA INCOME
100.0/ 100
METRIC RATING
38th/ 347
METRIC RANK
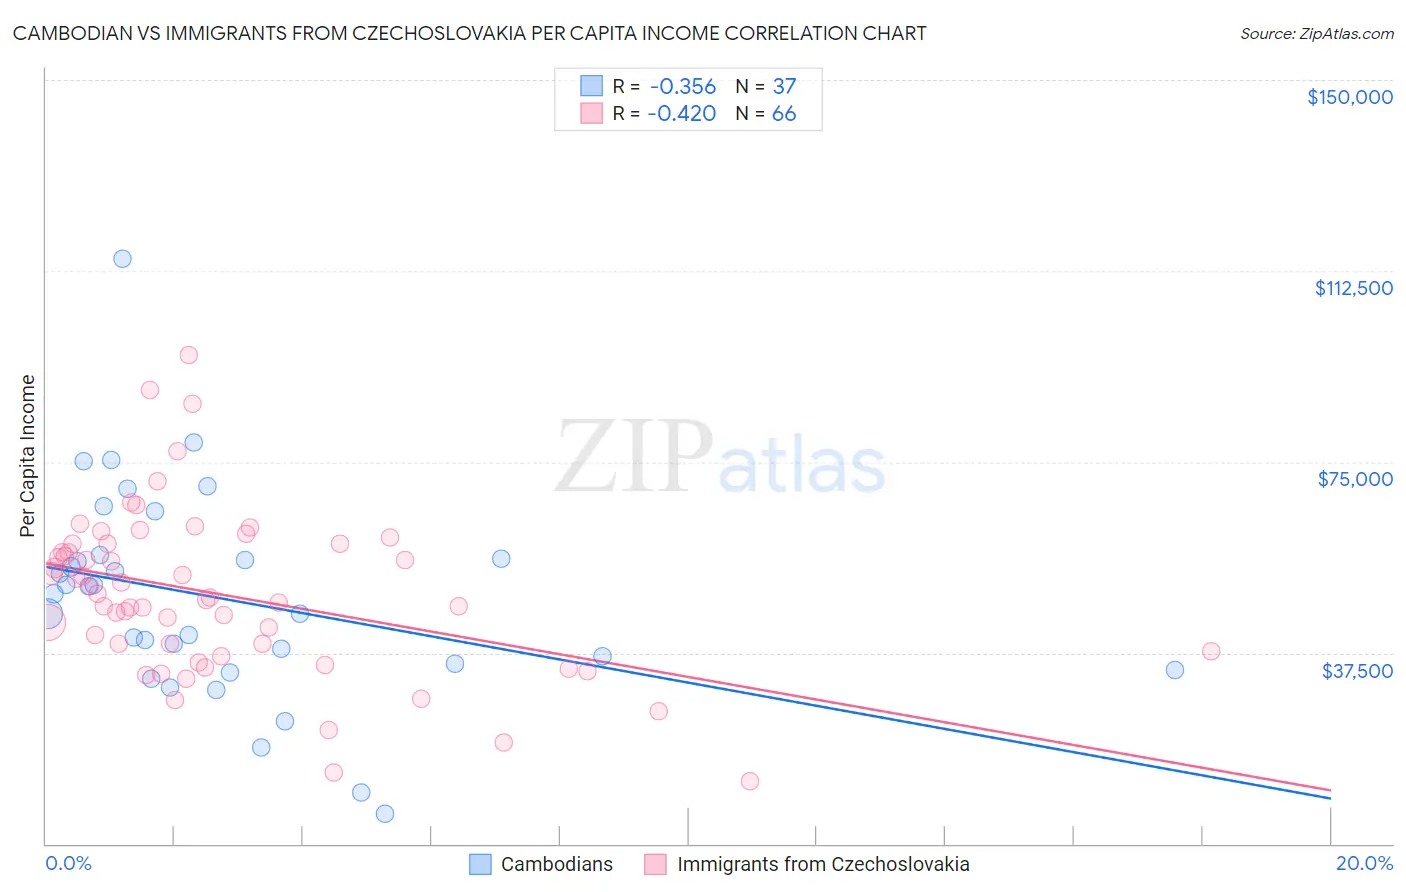
Cambodian vs Immigrants from Czechoslovakia Per Capita Income Correlation Chart
The statistical analysis conducted on geographies consisting of 102,519,941 people shows a mild negative correlation between the proportion of Cambodians and per capita income in the United States with a correlation coefficient (R) of -0.356 and weighted average of $51,731. Similarly, the statistical analysis conducted on geographies consisting of 195,456,516 people shows a moderate negative correlation between the proportion of Immigrants from Czechoslovakia and per capita income in the United States with a correlation coefficient (R) of -0.420 and weighted average of $51,770, a difference of 0.070%.
Per Capita Income Correlation Summary
| Measurement | Cambodian | Immigrants from Czechoslovakia |
| Minimum | $5,866 | $12,340 |
| Maximum | $114,830 | $95,878 |
| Range | $108,964 | $83,538 |
| Mean | $48,227 | $48,860 |
| Median | $49,059 | $48,155 |
| Interquartile 25% (IQ1) | $34,778 | $37,887 |
| Interquartile 75% (IQ3) | $56,350 | $58,814 |
| Interquartile Range (IQR) | $21,571 | $20,927 |
| Standard Deviation (Sample) | $20,684 | $16,197 |
| Standard Deviation (Population) | $20,403 | $16,074 |
Demographics Similar to Cambodians and Immigrants from Czechoslovakia by Per Capita Income
In terms of per capita income, the demographic groups most similar to Cambodians are Immigrants from Korea ($51,671, a difference of 0.12%), Estonian ($51,875, a difference of 0.28%), Immigrants from Greece ($51,891, a difference of 0.31%), Immigrants from South Africa ($51,465, a difference of 0.52%), and Burmese ($52,005, a difference of 0.53%). Similarly, the demographic groups most similar to Immigrants from Czechoslovakia are Immigrants from Korea ($51,671, a difference of 0.19%), Estonian ($51,875, a difference of 0.20%), Immigrants from Greece ($51,891, a difference of 0.23%), Burmese ($52,005, a difference of 0.45%), and Immigrants from Russia ($52,044, a difference of 0.53%).
| Demographics | Rating | Rank | Per Capita Income |
| Latvians | 100.0 /100 | #28 | Exceptional $52,649 |
| Israelis | 100.0 /100 | #29 | Exceptional $52,596 |
| Immigrants | Austria | 100.0 /100 | #30 | Exceptional $52,503 |
| Turks | 100.0 /100 | #31 | Exceptional $52,391 |
| Immigrants | Norway | 100.0 /100 | #32 | Exceptional $52,217 |
| Australians | 100.0 /100 | #33 | Exceptional $52,074 |
| Immigrants | Russia | 100.0 /100 | #34 | Exceptional $52,044 |
| Burmese | 100.0 /100 | #35 | Exceptional $52,005 |
| Immigrants | Greece | 100.0 /100 | #36 | Exceptional $51,891 |
| Estonians | 100.0 /100 | #37 | Exceptional $51,875 |
| Immigrants | Czechoslovakia | 100.0 /100 | #38 | Exceptional $51,770 |
| Cambodians | 100.0 /100 | #39 | Exceptional $51,731 |
| Immigrants | Korea | 100.0 /100 | #40 | Exceptional $51,671 |
| Immigrants | South Africa | 100.0 /100 | #41 | Exceptional $51,465 |
| Immigrants | Turkey | 100.0 /100 | #42 | Exceptional $51,368 |
| Immigrants | Lithuania | 100.0 /100 | #43 | Exceptional $51,361 |
| Immigrants | Europe | 100.0 /100 | #44 | Exceptional $50,950 |
| Immigrants | Spain | 100.0 /100 | #45 | Exceptional $50,933 |
| Immigrants | Latvia | 100.0 /100 | #46 | Exceptional $50,914 |
| Bulgarians | 100.0 /100 | #47 | Exceptional $50,906 |
| Immigrants | Serbia | 100.0 /100 | #48 | Exceptional $50,810 |