Cambodian vs Senegalese Per Capita Income
COMPARE
Cambodian
Senegalese
Per Capita Income
Per Capita Income Comparison
Cambodians
Senegalese
$51,731
PER CAPITA INCOME
100.0/ 100
METRIC RATING
39th/ 347
METRIC RANK
$41,000
PER CAPITA INCOME
4.8/ 100
METRIC RATING
231st/ 347
METRIC RANK
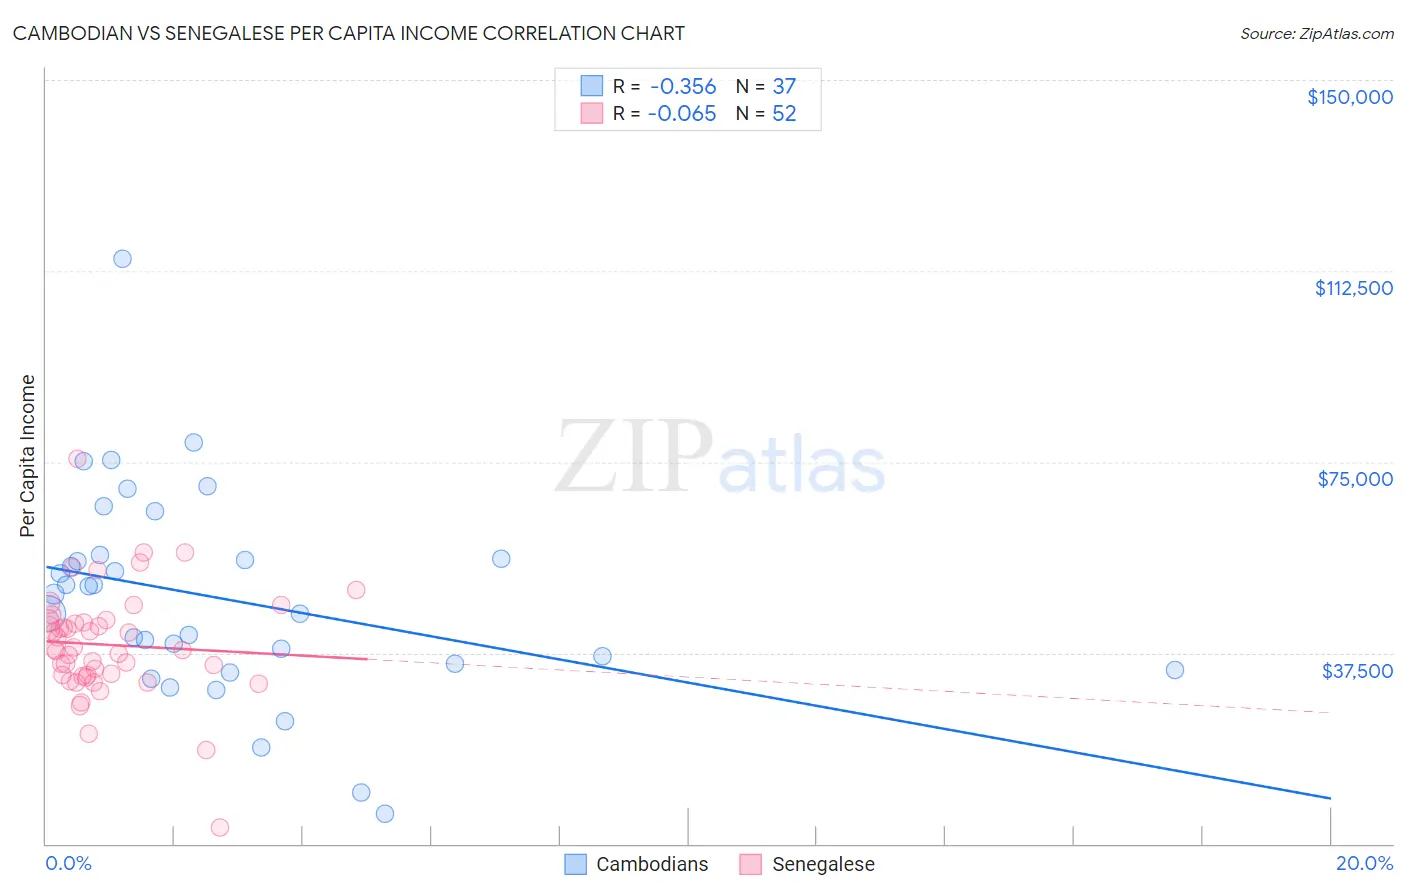
Cambodian vs Senegalese Per Capita Income Correlation Chart
The statistical analysis conducted on geographies consisting of 102,519,941 people shows a mild negative correlation between the proportion of Cambodians and per capita income in the United States with a correlation coefficient (R) of -0.356 and weighted average of $51,731. Similarly, the statistical analysis conducted on geographies consisting of 78,107,792 people shows a slight negative correlation between the proportion of Senegalese and per capita income in the United States with a correlation coefficient (R) of -0.065 and weighted average of $41,000, a difference of 26.2%.
Per Capita Income Correlation Summary
| Measurement | Cambodian | Senegalese |
| Minimum | $5,866 | $3,219 |
| Maximum | $114,830 | $75,539 |
| Range | $108,964 | $72,320 |
| Mean | $48,227 | $39,064 |
| Median | $49,059 | $38,147 |
| Interquartile 25% (IQ1) | $34,778 | $33,014 |
| Interquartile 75% (IQ3) | $56,350 | $43,632 |
| Interquartile Range (IQR) | $21,571 | $10,618 |
| Standard Deviation (Sample) | $20,684 | $10,948 |
| Standard Deviation (Population) | $20,403 | $10,843 |
Similar Demographics by Per Capita Income
Demographics Similar to Cambodians by Per Capita Income
In terms of per capita income, the demographic groups most similar to Cambodians are Immigrants from Czechoslovakia ($51,770, a difference of 0.070%), Immigrants from Korea ($51,671, a difference of 0.12%), Estonian ($51,875, a difference of 0.28%), Immigrants from Greece ($51,891, a difference of 0.31%), and Immigrants from South Africa ($51,465, a difference of 0.52%).
| Demographics | Rating | Rank | Per Capita Income |
| Immigrants | Norway | 100.0 /100 | #32 | Exceptional $52,217 |
| Australians | 100.0 /100 | #33 | Exceptional $52,074 |
| Immigrants | Russia | 100.0 /100 | #34 | Exceptional $52,044 |
| Burmese | 100.0 /100 | #35 | Exceptional $52,005 |
| Immigrants | Greece | 100.0 /100 | #36 | Exceptional $51,891 |
| Estonians | 100.0 /100 | #37 | Exceptional $51,875 |
| Immigrants | Czechoslovakia | 100.0 /100 | #38 | Exceptional $51,770 |
| Cambodians | 100.0 /100 | #39 | Exceptional $51,731 |
| Immigrants | Korea | 100.0 /100 | #40 | Exceptional $51,671 |
| Immigrants | South Africa | 100.0 /100 | #41 | Exceptional $51,465 |
| Immigrants | Turkey | 100.0 /100 | #42 | Exceptional $51,368 |
| Immigrants | Lithuania | 100.0 /100 | #43 | Exceptional $51,361 |
| Immigrants | Europe | 100.0 /100 | #44 | Exceptional $50,950 |
| Immigrants | Spain | 100.0 /100 | #45 | Exceptional $50,933 |
| Immigrants | Latvia | 100.0 /100 | #46 | Exceptional $50,914 |
Demographics Similar to Senegalese by Per Capita Income
In terms of per capita income, the demographic groups most similar to Senegalese are Native Hawaiian ($41,017, a difference of 0.040%), Nigerian ($41,026, a difference of 0.060%), Guyanese ($40,949, a difference of 0.12%), Immigrants from Grenada ($41,123, a difference of 0.30%), and Immigrants from Ghana ($41,131, a difference of 0.32%).
| Demographics | Rating | Rank | Per Capita Income |
| Immigrants | St. Vincent and the Grenadines | 6.4 /100 | #224 | Tragic $41,270 |
| West Indians | 6.0 /100 | #225 | Tragic $41,217 |
| Immigrants | Ecuador | 5.9 /100 | #226 | Tragic $41,195 |
| Immigrants | Ghana | 5.5 /100 | #227 | Tragic $41,131 |
| Immigrants | Grenada | 5.5 /100 | #228 | Tragic $41,123 |
| Nigerians | 4.9 /100 | #229 | Tragic $41,026 |
| Native Hawaiians | 4.9 /100 | #230 | Tragic $41,017 |
| Senegalese | 4.8 /100 | #231 | Tragic $41,000 |
| Guyanese | 4.5 /100 | #232 | Tragic $40,949 |
| Delaware | 3.8 /100 | #233 | Tragic $40,778 |
| Immigrants | West Indies | 3.7 /100 | #234 | Tragic $40,763 |
| Immigrants | Guyana | 3.6 /100 | #235 | Tragic $40,742 |
| Immigrants | Nonimmigrants | 3.4 /100 | #236 | Tragic $40,669 |
| Immigrants | Cambodia | 2.6 /100 | #237 | Tragic $40,434 |
| Somalis | 2.4 /100 | #238 | Tragic $40,367 |