Cambodian vs Bolivian Median Household Income
COMPARE
Cambodian
Bolivian
Median Household Income
Median Household Income Comparison
Cambodians
Bolivians
$96,324
MEDIAN HOUSEHOLD INCOME
99.9/ 100
METRIC RATING
48th/ 347
METRIC RANK
$102,195
MEDIAN HOUSEHOLD INCOME
100.0/ 100
METRIC RATING
20th/ 347
METRIC RANK
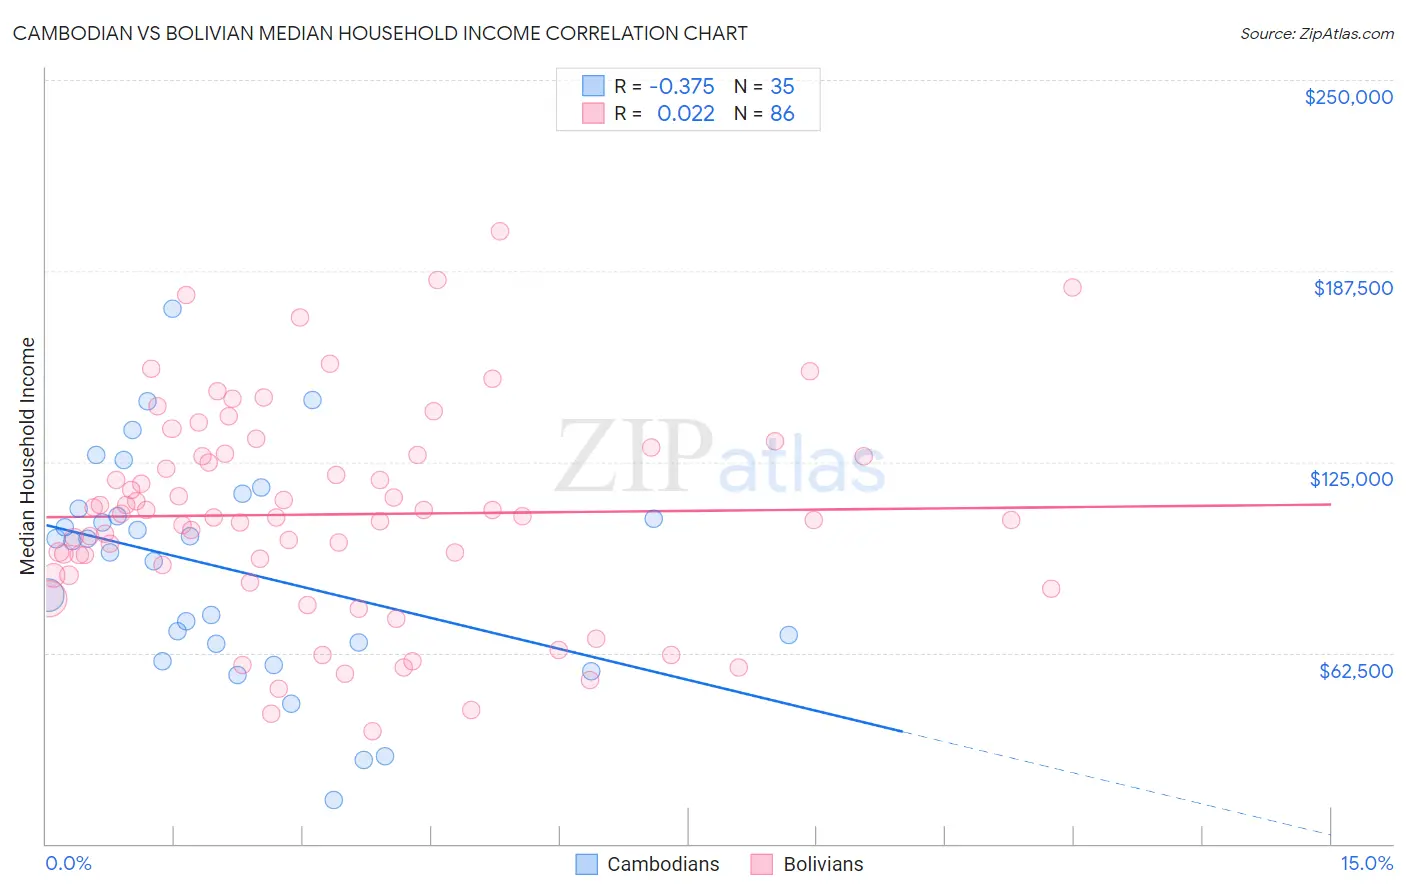
Cambodian vs Bolivian Median Household Income Correlation Chart
The statistical analysis conducted on geographies consisting of 102,460,584 people shows a mild negative correlation between the proportion of Cambodians and median household income in the United States with a correlation coefficient (R) of -0.375 and weighted average of $96,324. Similarly, the statistical analysis conducted on geographies consisting of 184,606,856 people shows no correlation between the proportion of Bolivians and median household income in the United States with a correlation coefficient (R) of 0.022 and weighted average of $102,195, a difference of 6.1%.
Median Household Income Correlation Summary
| Measurement | Cambodian | Bolivian |
| Minimum | $14,319 | $36,777 |
| Maximum | $174,929 | $200,625 |
| Range | $160,610 | $163,848 |
| Mean | $90,039 | $107,810 |
| Median | $99,162 | $106,861 |
| Interquartile 25% (IQ1) | $65,313 | $87,882 |
| Interquartile 75% (IQ3) | $109,510 | $127,141 |
| Interquartile Range (IQR) | $44,197 | $39,259 |
| Standard Deviation (Sample) | $35,802 | $34,248 |
| Standard Deviation (Population) | $35,287 | $34,049 |
Similar Demographics by Median Household Income
Demographics Similar to Cambodians by Median Household Income
In terms of median household income, the demographic groups most similar to Cambodians are Immigrants from Malaysia ($96,292, a difference of 0.030%), Bulgarian ($96,290, a difference of 0.040%), Immigrants from Russia ($96,378, a difference of 0.060%), Australian ($96,490, a difference of 0.17%), and Israeli ($96,552, a difference of 0.24%).
| Demographics | Rating | Rank | Median Household Income |
| Immigrants | Turkey | 100.0 /100 | #41 | Exceptional $96,964 |
| Immigrants | Lithuania | 99.9 /100 | #42 | Exceptional $96,836 |
| Immigrants | France | 99.9 /100 | #43 | Exceptional $96,743 |
| Immigrants | Greece | 99.9 /100 | #44 | Exceptional $96,675 |
| Israelis | 99.9 /100 | #45 | Exceptional $96,552 |
| Australians | 99.9 /100 | #46 | Exceptional $96,490 |
| Immigrants | Russia | 99.9 /100 | #47 | Exceptional $96,378 |
| Cambodians | 99.9 /100 | #48 | Exceptional $96,324 |
| Immigrants | Malaysia | 99.9 /100 | #49 | Exceptional $96,292 |
| Bulgarians | 99.9 /100 | #50 | Exceptional $96,290 |
| Estonians | 99.9 /100 | #51 | Exceptional $95,930 |
| Immigrants | South Africa | 99.9 /100 | #52 | Exceptional $95,800 |
| Paraguayans | 99.9 /100 | #53 | Exceptional $95,737 |
| Egyptians | 99.9 /100 | #54 | Exceptional $95,673 |
| Immigrants | Czechoslovakia | 99.9 /100 | #55 | Exceptional $95,319 |
Demographics Similar to Bolivians by Median Household Income
In terms of median household income, the demographic groups most similar to Bolivians are Immigrants from Australia ($102,562, a difference of 0.36%), Eastern European ($101,781, a difference of 0.41%), Asian ($101,681, a difference of 0.50%), Cypriot ($102,843, a difference of 0.63%), and Immigrants from Korea ($102,962, a difference of 0.75%).
| Demographics | Rating | Rank | Median Household Income |
| Immigrants | Eastern Asia | 100.0 /100 | #13 | Exceptional $104,796 |
| Immigrants | Ireland | 100.0 /100 | #14 | Exceptional $104,692 |
| Immigrants | Israel | 100.0 /100 | #15 | Exceptional $104,090 |
| Burmese | 100.0 /100 | #16 | Exceptional $103,145 |
| Immigrants | Korea | 100.0 /100 | #17 | Exceptional $102,962 |
| Cypriots | 100.0 /100 | #18 | Exceptional $102,843 |
| Immigrants | Australia | 100.0 /100 | #19 | Exceptional $102,562 |
| Bolivians | 100.0 /100 | #20 | Exceptional $102,195 |
| Eastern Europeans | 100.0 /100 | #21 | Exceptional $101,781 |
| Asians | 100.0 /100 | #22 | Exceptional $101,681 |
| Immigrants | Bolivia | 100.0 /100 | #23 | Exceptional $101,394 |
| Immigrants | Japan | 100.0 /100 | #24 | Exceptional $100,711 |
| Immigrants | Sweden | 100.0 /100 | #25 | Exceptional $100,699 |
| Immigrants | Belgium | 100.0 /100 | #26 | Exceptional $100,306 |
| Bhutanese | 100.0 /100 | #27 | Exceptional $100,151 |